Behind Actionability: The Axonius Asset Intelligence Pipeline

Ivan Dwyer
Principal Product Marketing Strategist, Axonius

Action depends on truth. Truth is hard to come by.
Before you can automate a response, enforce a policy, apply a control, or deploy a patch, you must be confident in the data driving those decisions. Detection logic, access rules, and remediation playbooks are only as effective as the context they operate on. And today, that context is often unreliable – fragmented across tools, inconsistent between systems, and often stale by the time it’s needed.

In security, decisions are made within a context window. For humans, that means relying on what is visible and trustworthy, giving rise to the old trope, “you can’t protect what you can’t see”. As AI becomes part of modern security workflows, the principle hasn’t changed, but the stakes have. Now we should be thinking, “AI acts on what it sees”.
This data challenge has been the opportunity Axonius has been tackling since our inception. Our Adapter Network now integrates bi-directionally with more than 1,200 systems of all kinds, giving us the reach to retrieve every piece of relevant asset context from every corner of the enterprise – attributes, state, ownership, relationships, and posture.
But it’s far more than an integration catalog. Turning raw, noisy, and overlapping data into a complete, accurate, and always up-to-date model of your entire IT environment is hard. This post walks through the Axonius Asset Intelligence pipeline – the information foundation of our entire platform.
The Axonius Asset Intelligence Pipeline
The bar we set for the information we serve is decision-grade output. Each stage in this pipeline solves a specific class of data engineering problems that static inventories, vuln scanners, SIEMs, and CMDBs are unequipped to handle.
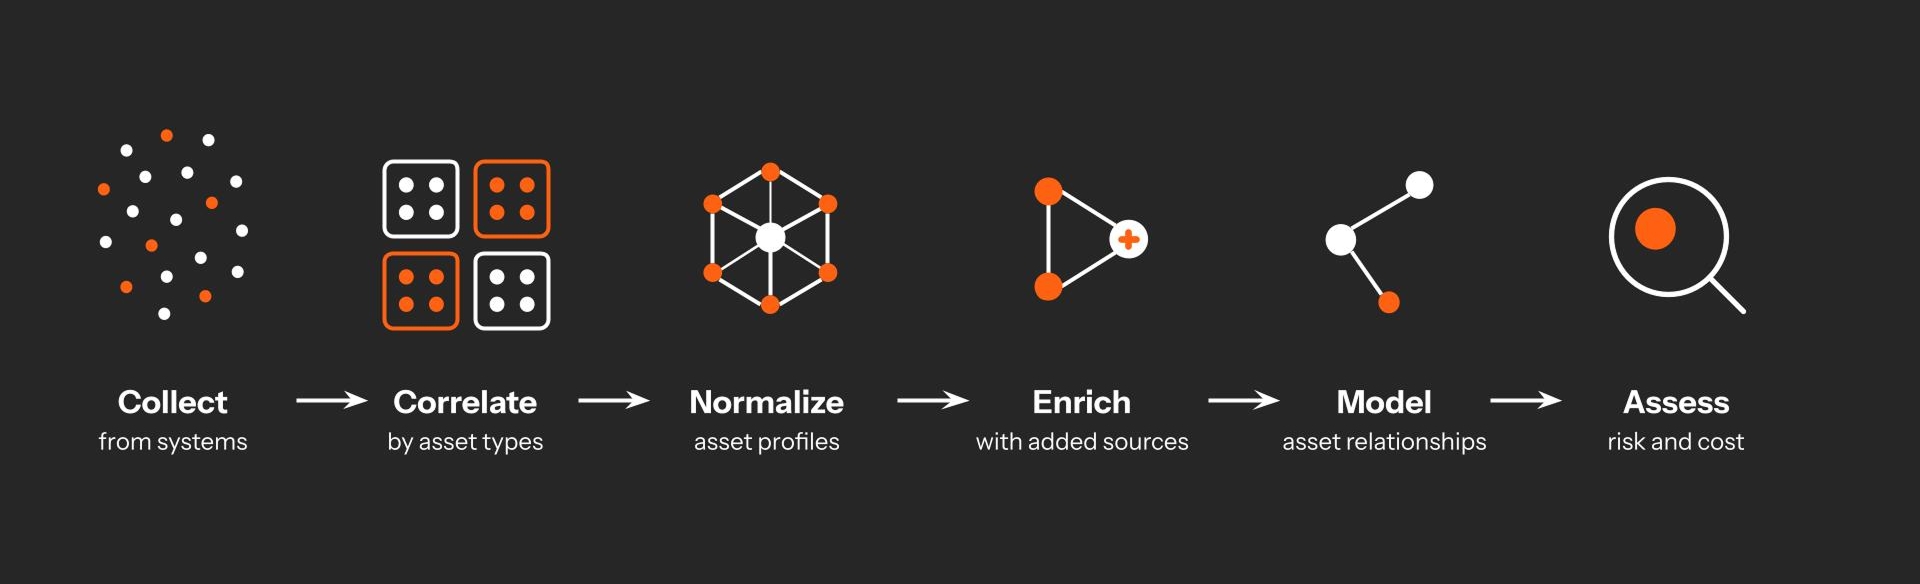
The Axonius Asset Intelligence Pipeline
Collect: Ingest raw asset and system configuration data from every integrated source using a highly parallelized adapter framework built for scale and resilience.
Correlate: Resolve entities across systems with a field-aware engine refined over years to unify noisy, conflicting records into a single, trusted profile.
Normalize: Apply schema-level logic and deconfliction rules to standardize fields, reconcile discrepancies, and maintain clean, query-ready data.
Enrich: Layer in external intelligence and internal context to complete asset profiles with ownership, criticality, risk, and compliance metadata.
Model: Continuously map relationships across assets by type, forming a dynamic, inferred graph of your environment and its dependencies.
Assess: Surface coverage gaps, exposures, misconfigurations, and inefficiencies with prebuilt logic and custom rules that adapt to your environment.
Stage 1: Collect
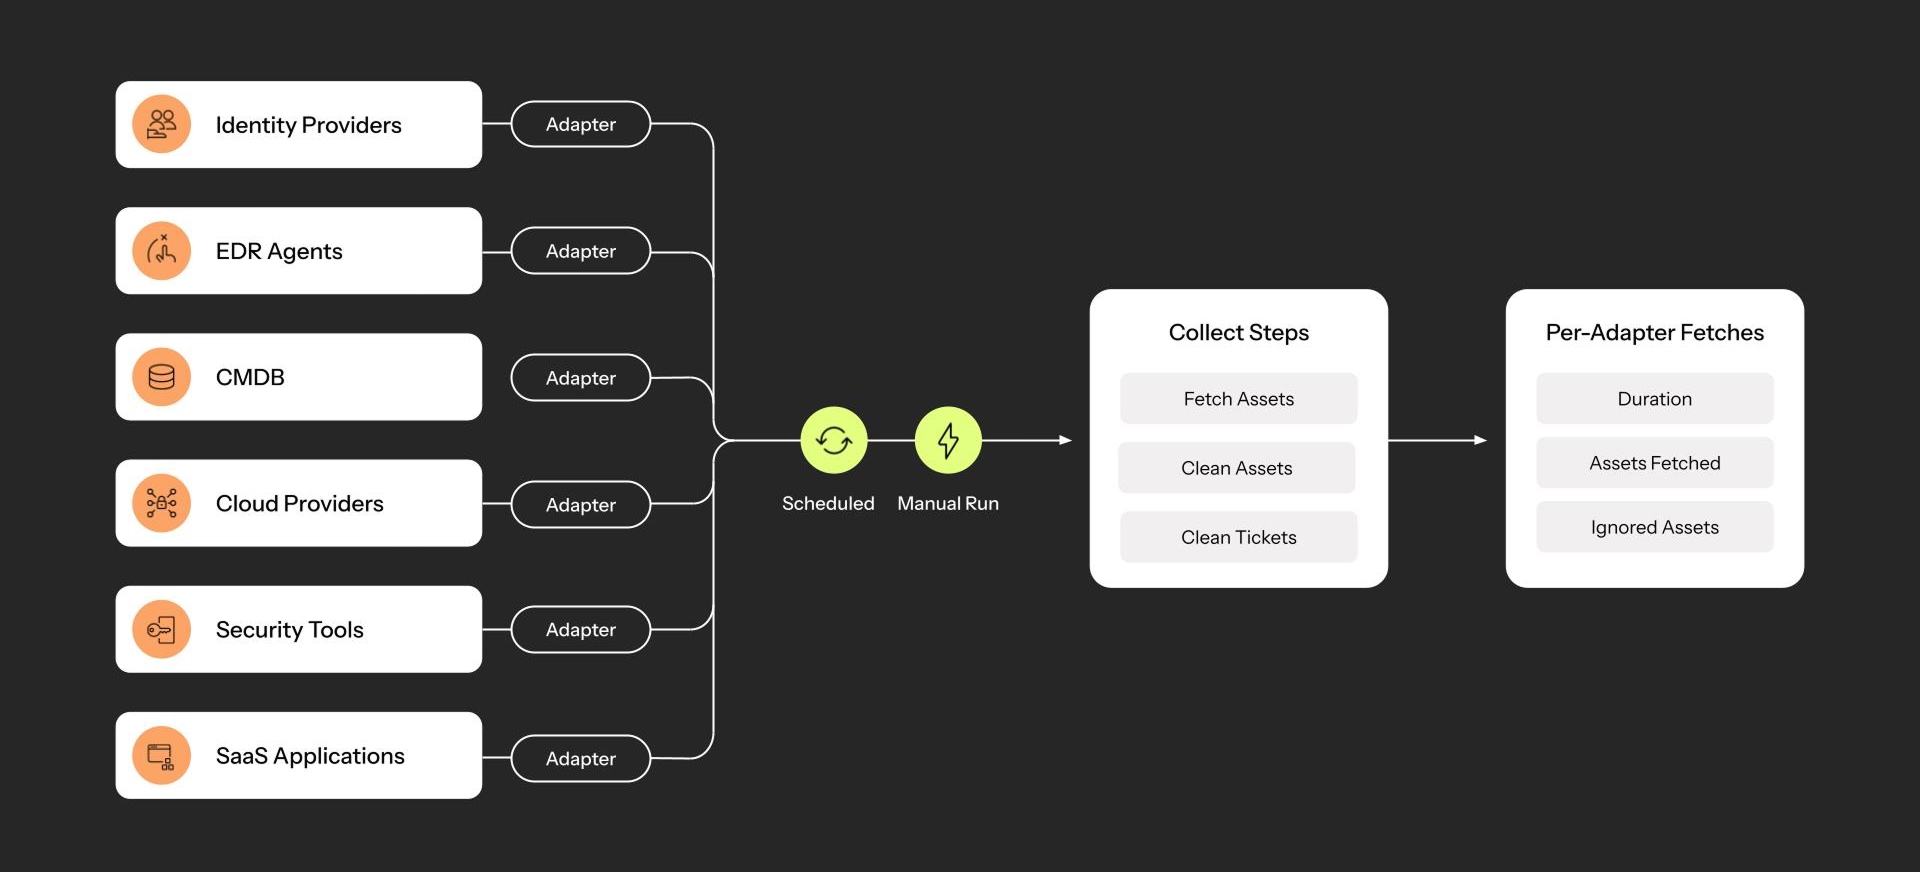
The discovery process via adapter connections
Our assertion has always been that a small number of control planes in your IT stack, when effectively aggregated, reveal the full picture of your environment. An MDM agent, an IdP, a vulnerability scanner, a SaaS app – somewhere in your stack, every asset leaves a signal. Completing that picture is the crux of this pipeline, and it starts with collection.
Every security tool claims to “discover” assets. But continuously collecting the right data from the right systems in the right way is far from trivial.
Every source has its own schema, authentication flow, and quirks (paging, rate limits, throttling, etc.)
Some APIs return incomplete records (i.e. vuln scanners without MACs or hostnames)
Many asset types don’t show up in traditional discovery systems (ephemeral cloud resources, BYOD, Unmanaged SaaS Apps, etc.)
The Adapter framework is designed to fetch system and asset data from every integrated source – endpoint services, cloud platforms, identity providers, security tools, SaaS apps, and more. APIs were the inflection point that enabled this architecture, transforming once-static tools into live sources of truth. Each Adapter is engineered to match the nuances of its source system:
Handle all connection logic (auth, session management, endpoint discovery)
Fetch raw asset data at configurable intervals
Translate inconsistent data formats into a structured intermediate representation
Annotate all records with freshness indicators, source identifiers, and metadata for downstream correlation
Gracefully handle API errors, timeouts, and rate limits with retry and backoff strategies
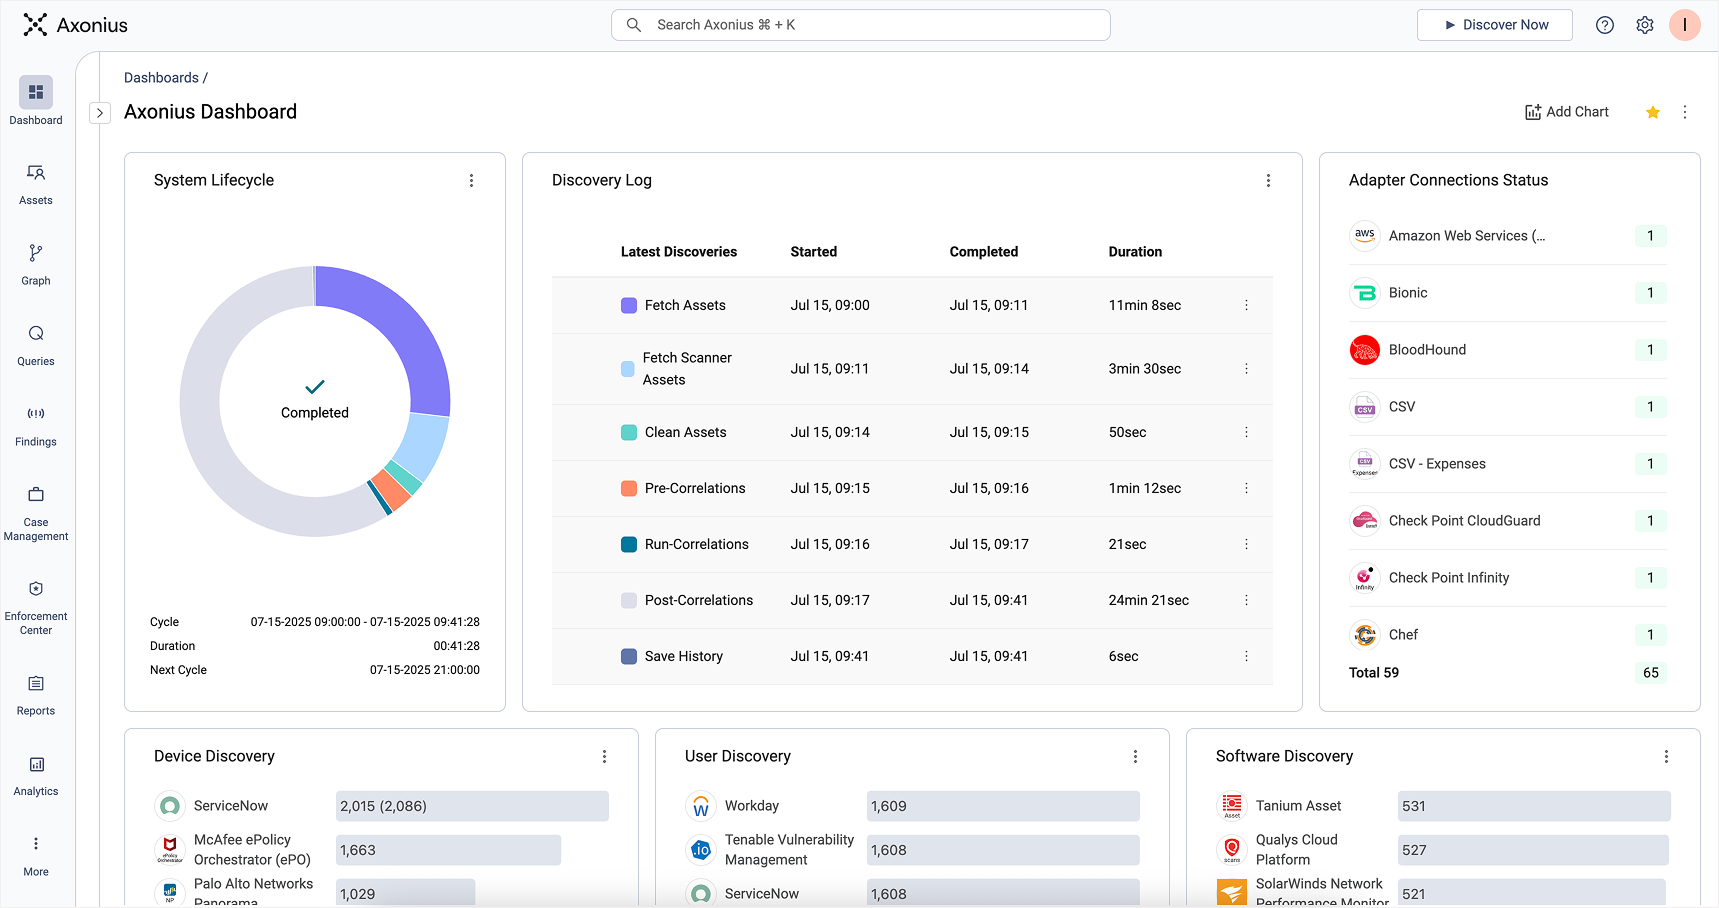
Discovery is a continuously scheduled operation to match how frequently your environment changes without overwhelming source systems – configurable globally, per adapter, or even per connection. Each cycle runs in parallel, multi-threaded, and batched for scale, with built-in monitoring to detect and handle failures. For urgent needs, discovery jobs can also be triggered on demand. Per-adapter diagnostics show exactly what data was fetched, when, and from where, to support traceability, auditing, and debugging.
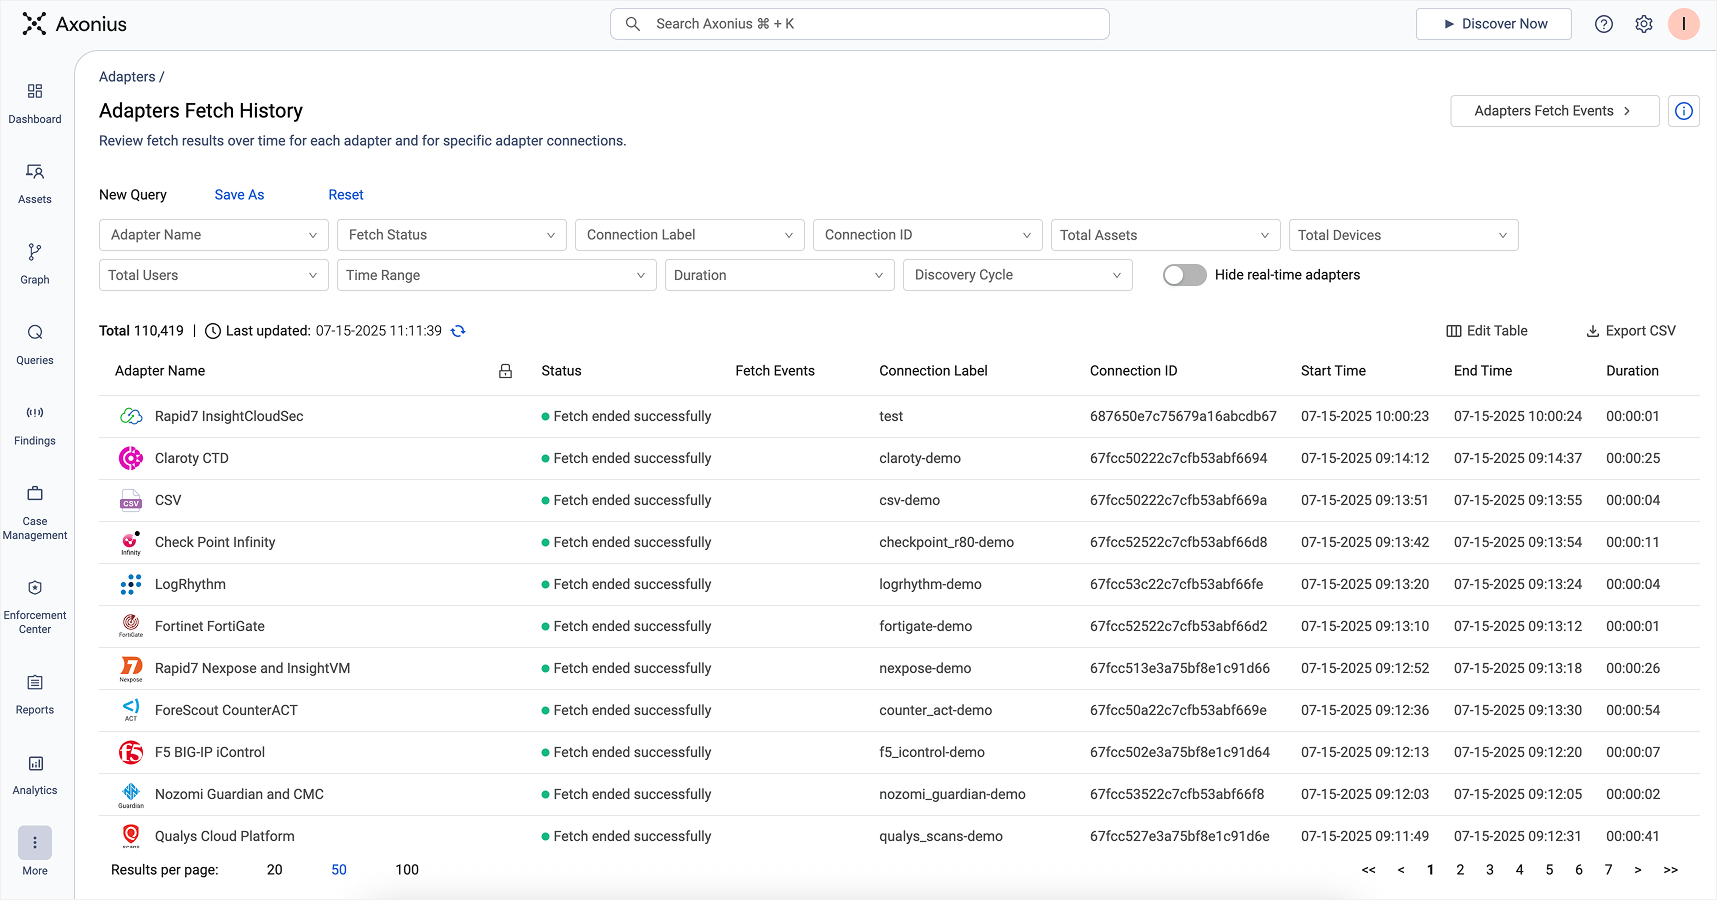
Every Adapter instance’s fetch history is logged with assets discovered by type
The result is a high-fidelity ingestion layer that establishes the baseline for the entire pipeline with fresh, structured system and asset data.
Stage 2: Correlate
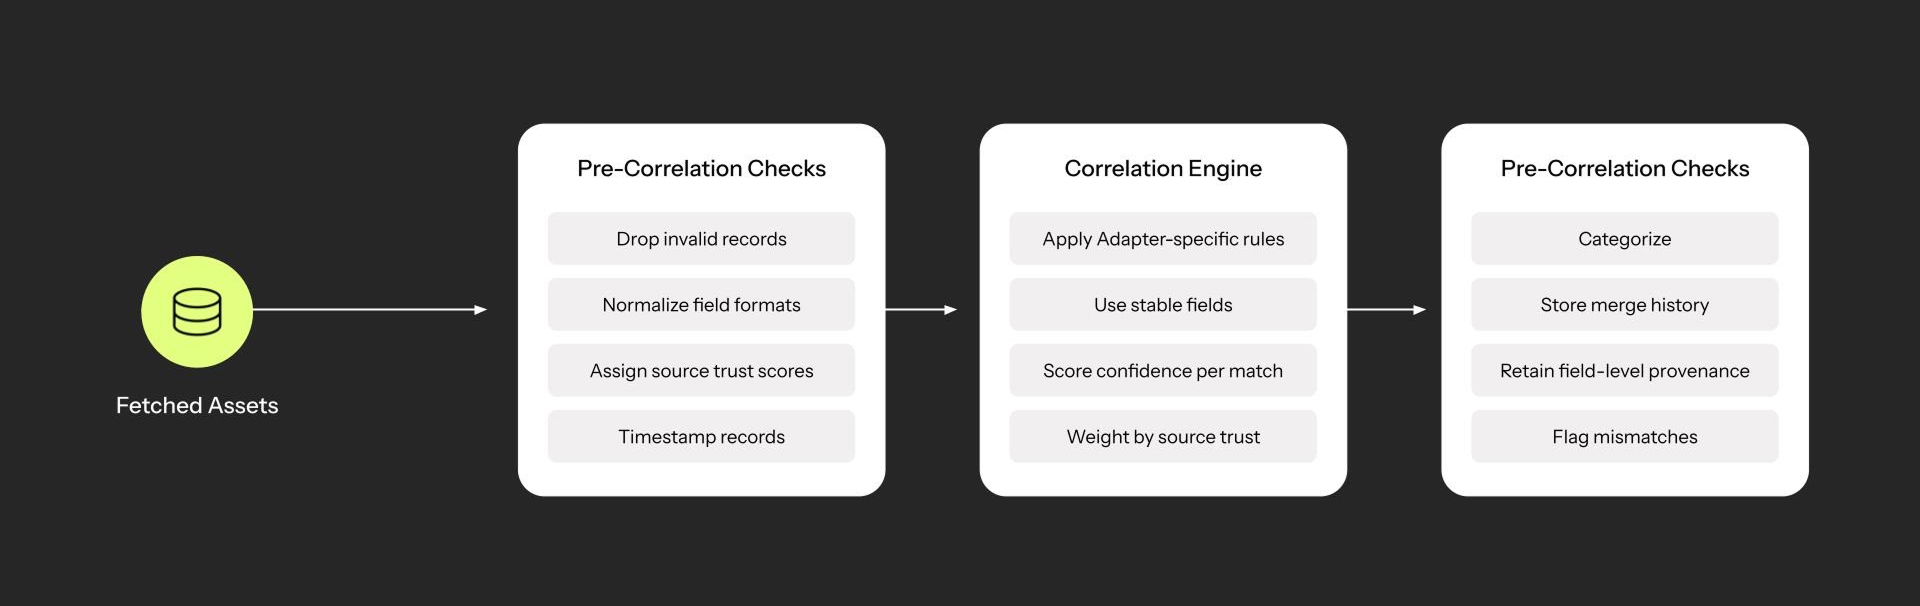
Complete set of correlation steps taken in sequence
Raw system data is messy. Correlation is the process of resolving which data actually represents a unique asset across tools, timestamps, and identifiers – and it’s one of the hardest problems to solve at scale.
The same device might appear in multiple systems with conflicting values: hostnames vs. FQDNs, internal vs. external IPs, or multiple usernames
Overlapping IP spaces and generic names like “demo” make it hard to distinguish distinct assets
Ephemeral assets, like VDI machines or cloud instances, spin up and down with recycled names and addresses
Some sources lack stable identifiers entirely, like vulnerability scans without hostnames or changing cloud instance IDs
Correlating too aggressively merges distinct entities. Under-correlating leads to conflicting records. This isn’t simply a cleanup task – it’s a real-time decision engine that has to resolve every asset at scale, while in flight, and with imperfect data.
At Axonius, correlation and deduplication go hand in hand. Once all raw records are collected during the global discovery cycle, we evaluate every entity using a rules-based correlation engine. The goal: reduce thousands of overlapping inputs into a single, authoritative asset profile.
Correlation rules are field-aware and tailored to each adapter – prioritizing stable identifiers like MAC address, hostname, serial number, domain, and user ID
We apply a confidence-weighted scoring model, with source-level trust hierarchies (i.e. AD and ITAM are considered high-fidelity; vuln scanners are noisy and low-trust)
The system avoids correlation on unstable fields like IP address unless explicitly configured
Multiple records from different sources are merged into a single asset, but with source-level field provenance retained
All correlation outcomes are logged and inspectable. The Axonius platform surfaces merge histories and field conflicts at the asset level. This not only increases trust, but provides a path to validation, debugging, refinement, and continuous improvement.
Correlation steps across Adapters are detailed with every Discovery Cycle
The result is deduplicated, unified profiles across many distinct asset types – clean enough to trust, structured enough to query, and rich enough to power everything downstream.
Stage 3: Normalize
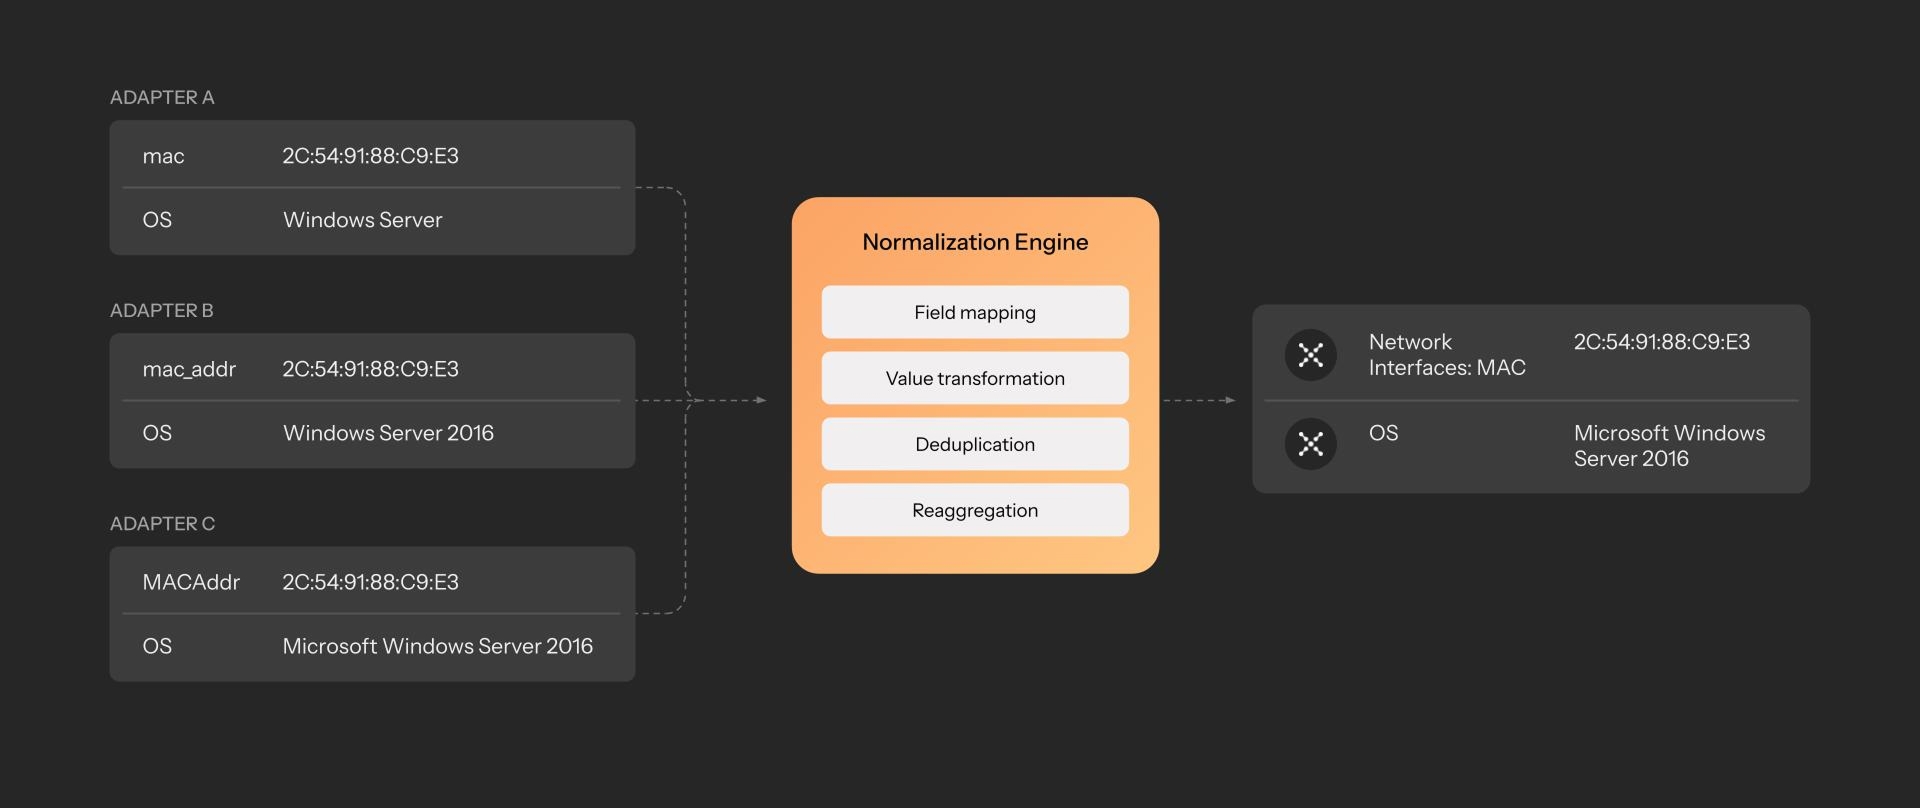
Example normalization process across mismatched field names and values
Even after the correlation stage, asset profiles can get messy in their own right. Different systems may use different field names, formats, and values, even when they’re describing the same thing.
One system reports Windows Server 2016 Std, another says Microsoft Windows Server 2016 Standard Edition, and a third just says 2016 STD
MAC addresses may show up as mac, MACAddress, nic_address, or buried inside nested JSON blobs
Timestamps like last seen or last checked in can appear under different field names or formats across systems
Normalization in Axonius isn’t a one-time cleanup job – it’s a continuous process applied during every discovery cycle. Some normalization happens at collection time to support correlation, but the heavy lifting comes once asset entities are resolved.
Here, we map inconsistent, vendor-specific field names to a common internal schema that spans device, user, software, identity, and policy attributes. That schema is versioned, extensible, and applied uniformly across every adapter.
Adapter-specific mappings translate raw fields to Axonius common fields during ingest
Value normalization transforms variants of common fields (i.e. OS names, status enums, date formats) into canonical representations
We maintain a library of normalization logic for edge cases, vendor-specific quirks, and known inconsistencies
Fields are evaluated during reaggregation to identify and consolidate duplicate values
All normalized data retains links to the original raw source, enabling traceability and audit
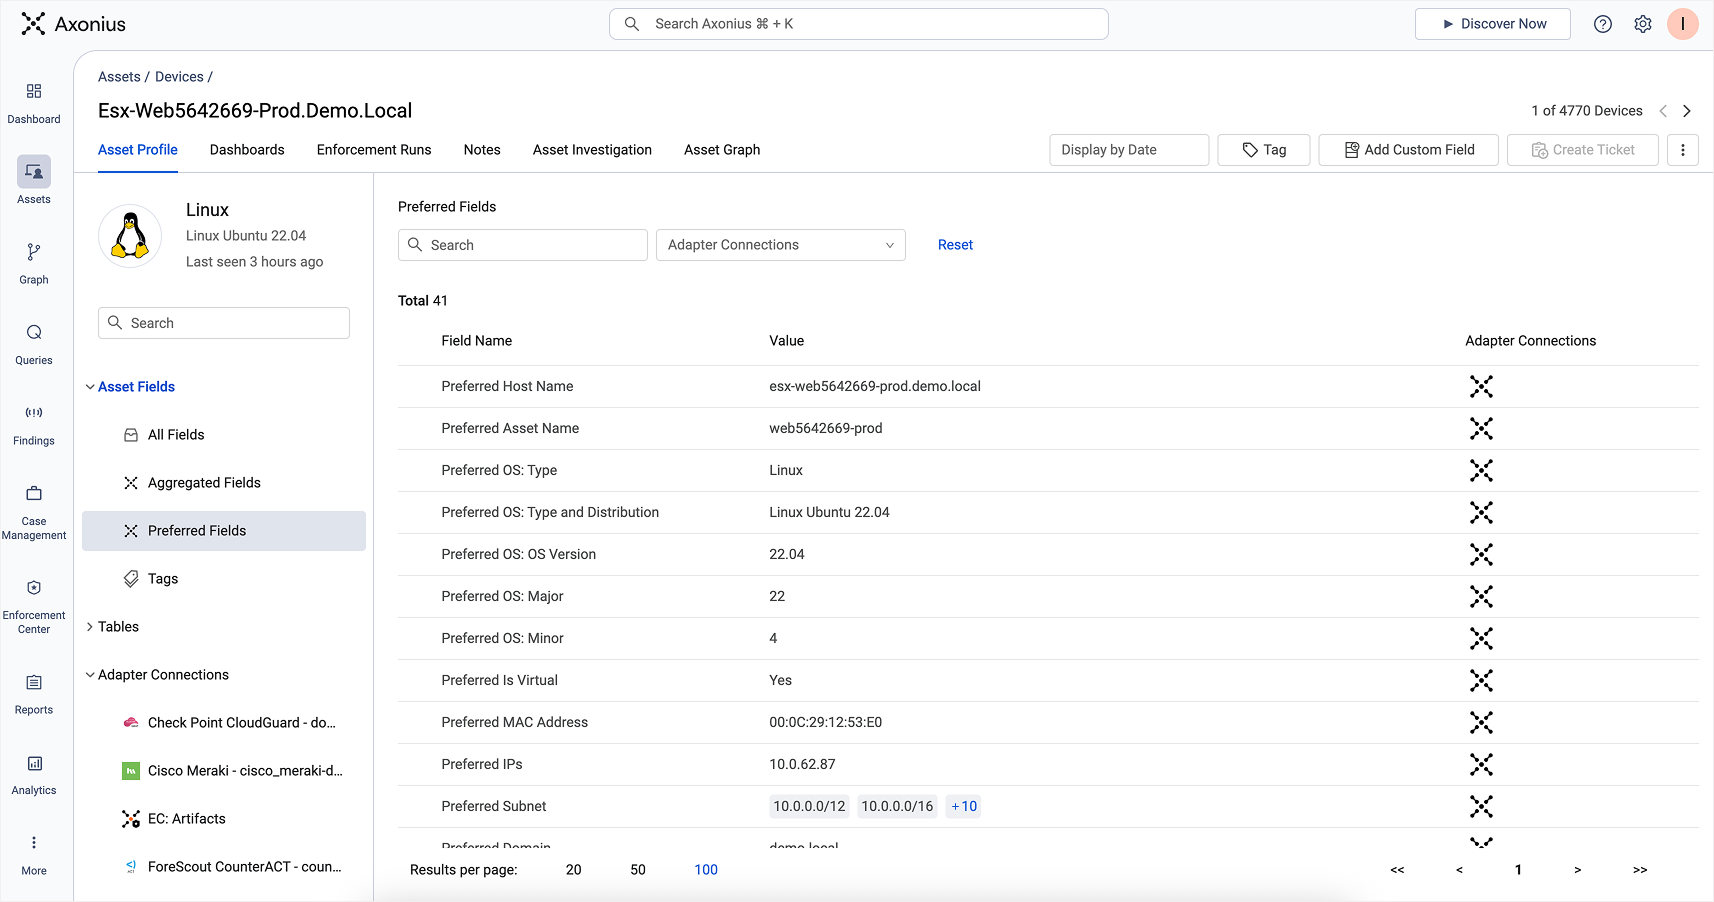
Preferred Fields in an Asset Profile view represent the result of the normalization process
Without normalization, querying would be guesswork. You’d have to know every possible variant of every value, field, and format across systems. With normalization, you can ask a question once and get a consistent answer.
Stage 4: Enrich
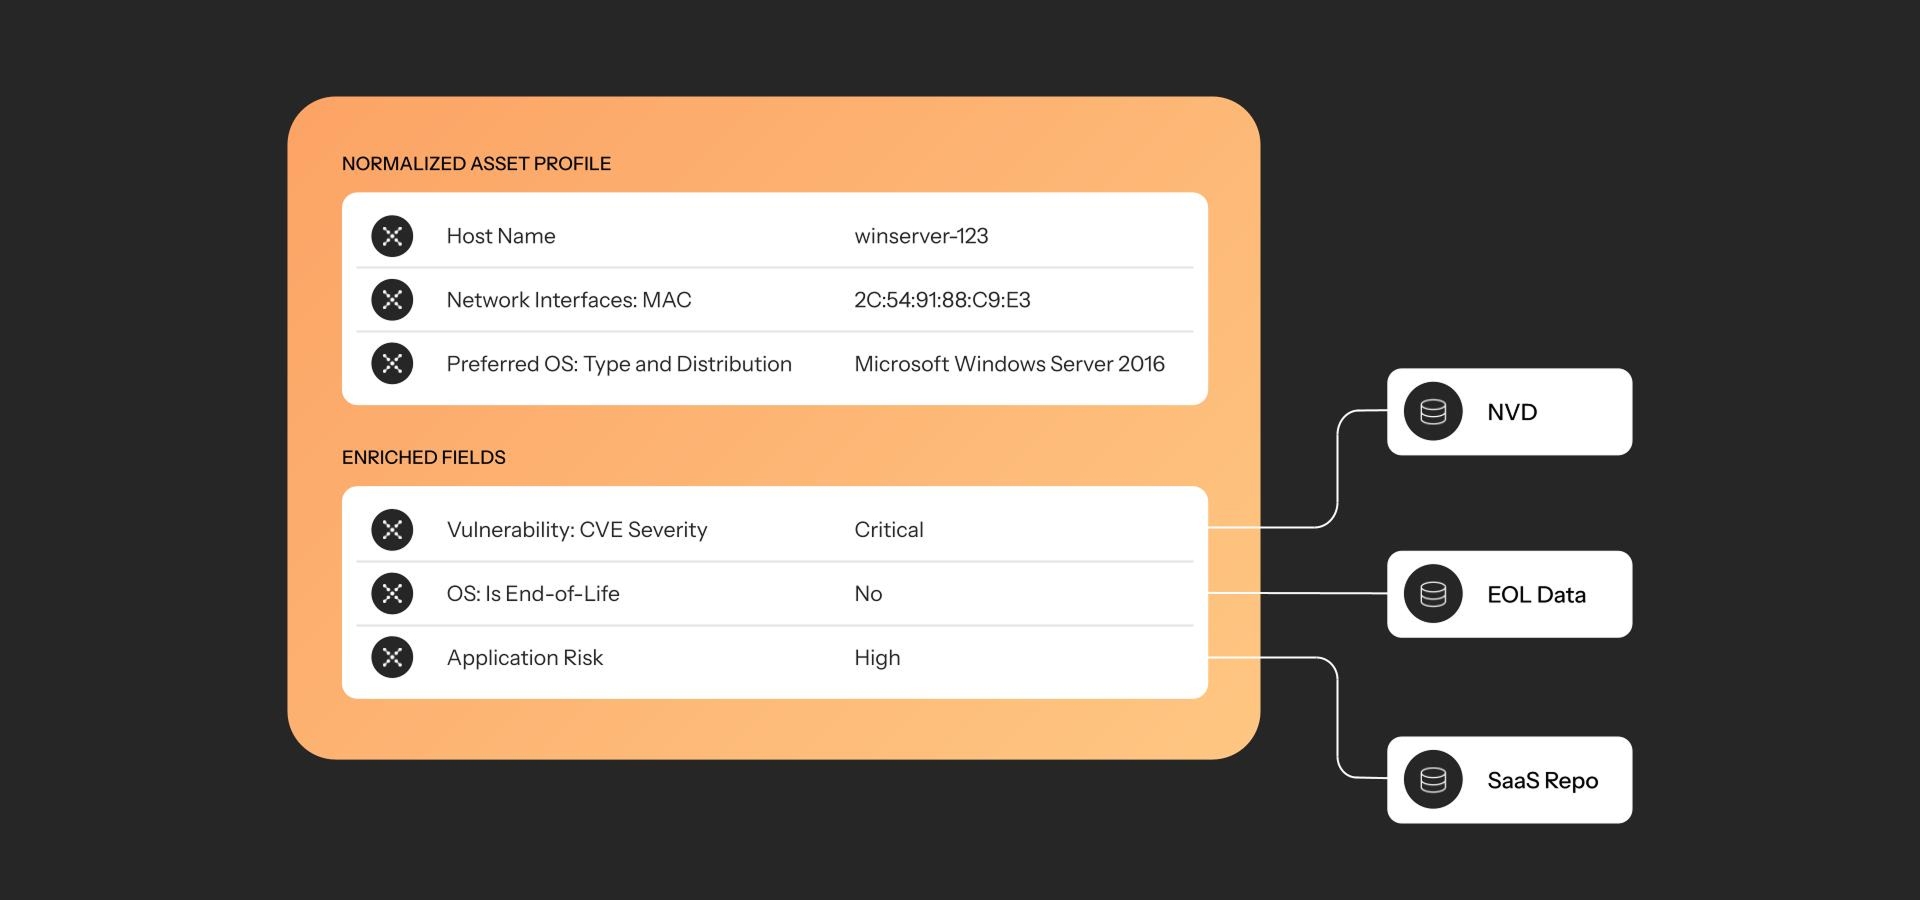
Example set of enrichment fields applied to an asset profile from various sources
Once assets are fully correlated and normalized through the Adapter Network, you gain a clean view of every asset and its state. In many ways, this is enough to uncover coverage gaps, fix misconfigurations, address exposures, and optimize inefficiencies. External forces, however, have an impact on what that state means in day-to-day operations:
Is this installed software End-of-Life?
Is that device affected by the latest 0-day?
Does this SaaS app meet our compliance requirements?
Is this admin account part of a data breach?
That’s where enrichment comes in – layering in external context to make otherwise static data operationally meaningful for specific use cases. But it comes with its own set of challenges.
Data formats, identifiers, and field names vary wildly across enrichment sources, requiring custom parsing, vendor understanding, and transformation
External feeds like CVEs and EOL datasets update frequently, requiring regular sync and validation
Over-enrichment can degrade performance or create noisy, low-signal data unless carefully scoped
Enrichment in Axonius complements our Adapter architecture. Adapters provide deep, bi-directional integrations with the control planes of record, pulling asset and system data directly from the source and enabling actions in return. External sources enhance what we already know, rather than stand in for what we don’t.
The enrichment process is applied after correlation and normalization, once a unified asset profile exists.
Enrichment sources are matched to asset records using normalized fields like software name, version, domain, or app identifier
Select asset attributes such as Vulnerability: CVE Severity, Software:End of Life, or SaaS:Compliance are injected directly into the asset profile as fields
Enrichment data is refreshed at regular intervals to reflect changes in threat intel, vendor status, or risk scoring
Some enrichment sources originate from third-party data feeds; others are maintained directly by Axonius. For example, we maintain a proprietary SaaS Application Repository that includes risk assessments, compliance indicators, and functional categorization for over 2,000 applications.
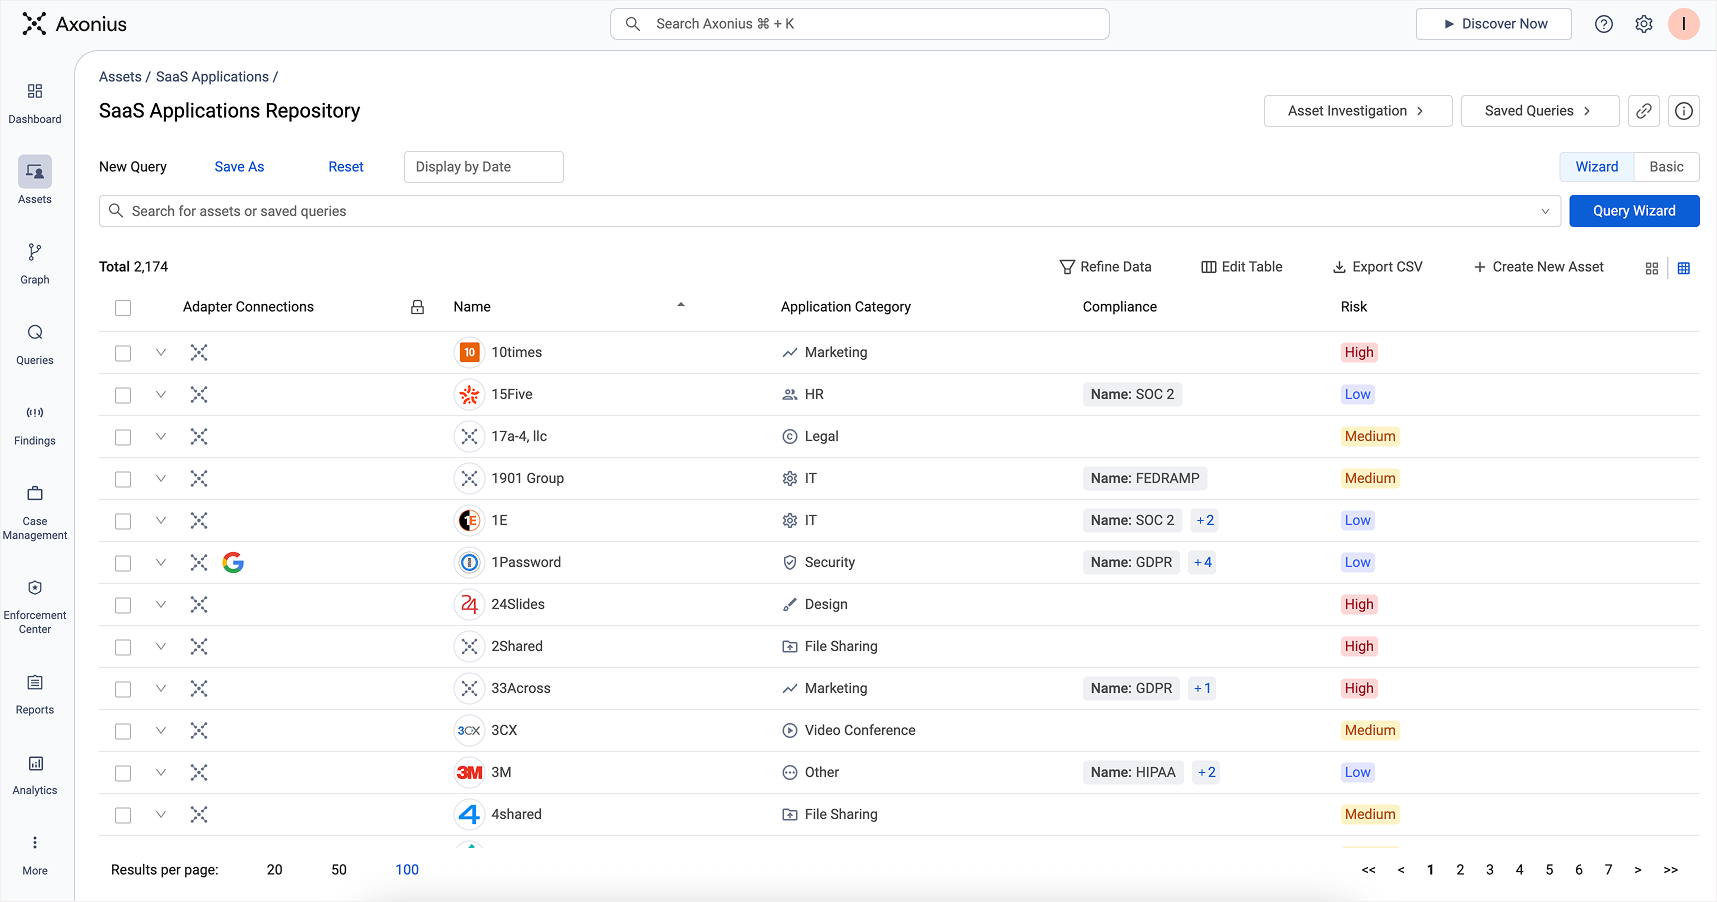
The SaaS Applications Repository is an enrichment source maintained by Axonius
Stage 5: Model
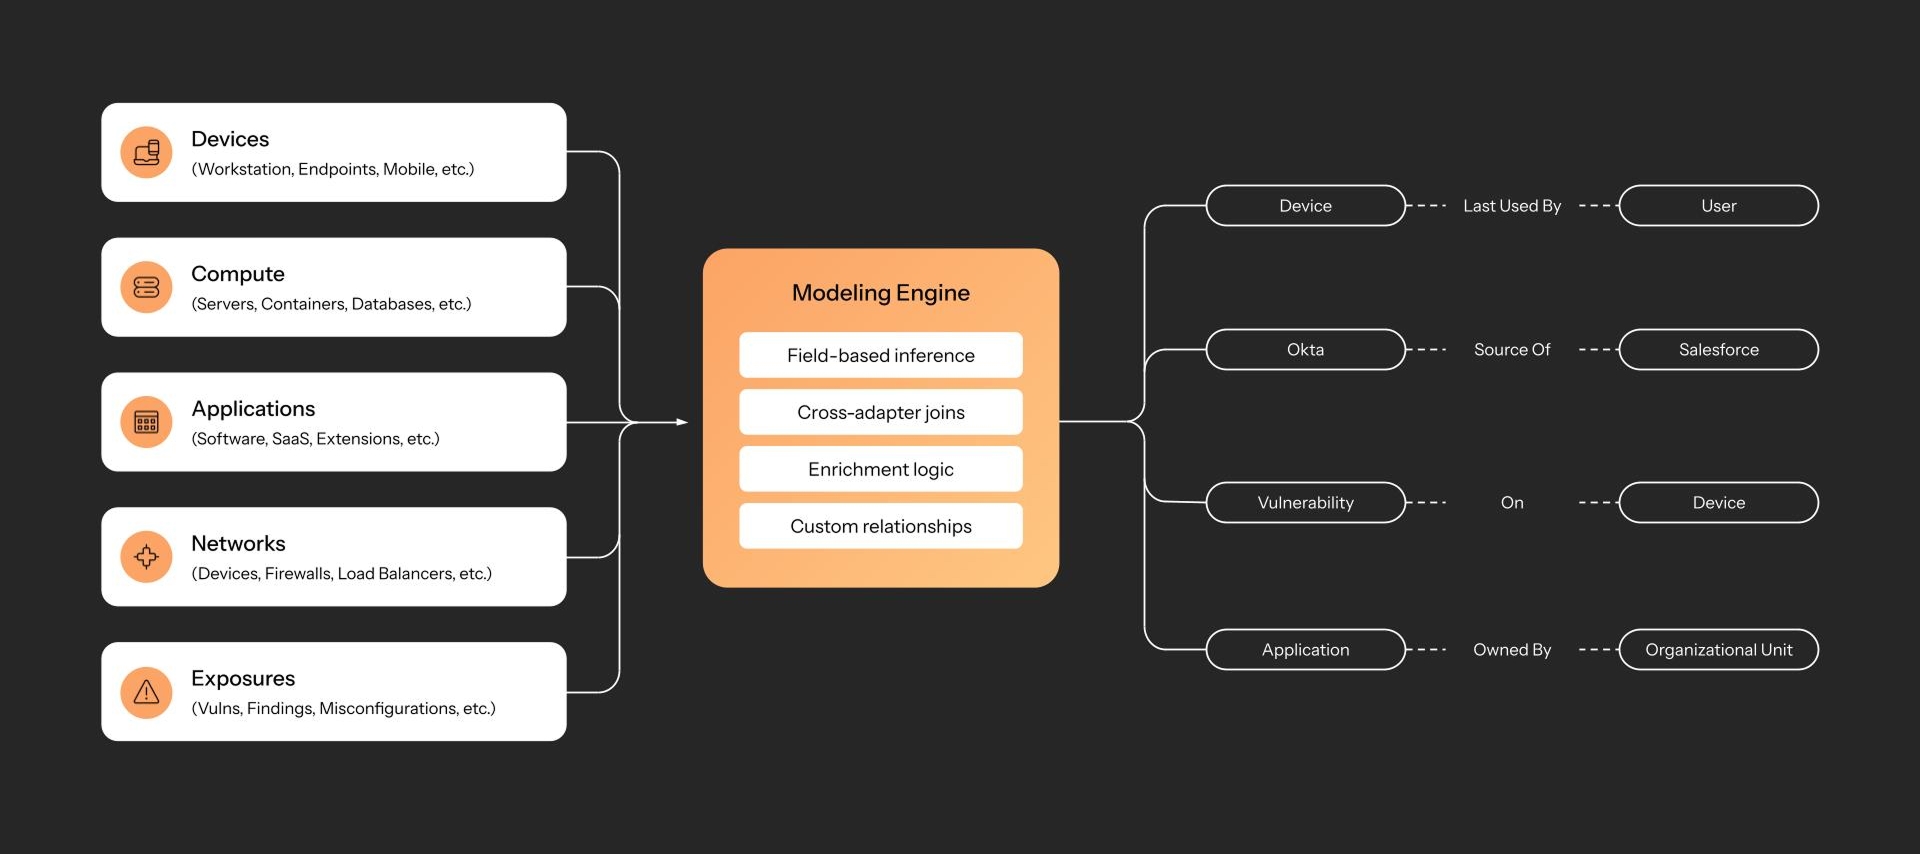
Methods of modeling relationships between assets
With complete, accurate, and up-to-date asset profiles across types, the next stage is understanding how they relate to reflect the real structure of the total environment – users to devices, software to vulnerabilities, identities to applications, and more. Real world environments never fit into a single schema, however.
Relationships are fragmented across systems, and must be resolved across domains
Many associations are implicit, not explicitly defined
Relationship accuracy depends on timing and freshness
Attack paths cross boundaries requiring traversal awareness across layers
Modeling must scale across millions of relationships without creating brittle chains
We operate under the belief that meaningful relationships across domains can be derived from a select number of control planes – the core systems that manage identity, endpoints, and infrastructure to name a few. These systems define how assets are connected, governed, and exposed. When aggregated, they reveal the true structure of the environment.
Axonius builds an inferred model of these relationships using the structured, normalized data already collected during the discovery and enrichment stages. These relationships are continuously updated to reflect current topology, policy scope, and exposure reach across domains.
Some relationships are more obvious to infer than others, such as mapping applications to users through IdP assignments. A few “aha” examples include:
Mapping public IPs to internal assets by analyzing firewall and load balancer configurations
Mapping unmanaged SaaS apps by comparing expense reports to SSO configurations
Mapping orphaned assets by identifying infrastructure assets that lack ownership metadata from the CMDB
Mapping excessive spend by identifying SaaS licenses that are attached to disabled users in the HRIS
Mapping policy drift by comparing on-device state with MDM reports
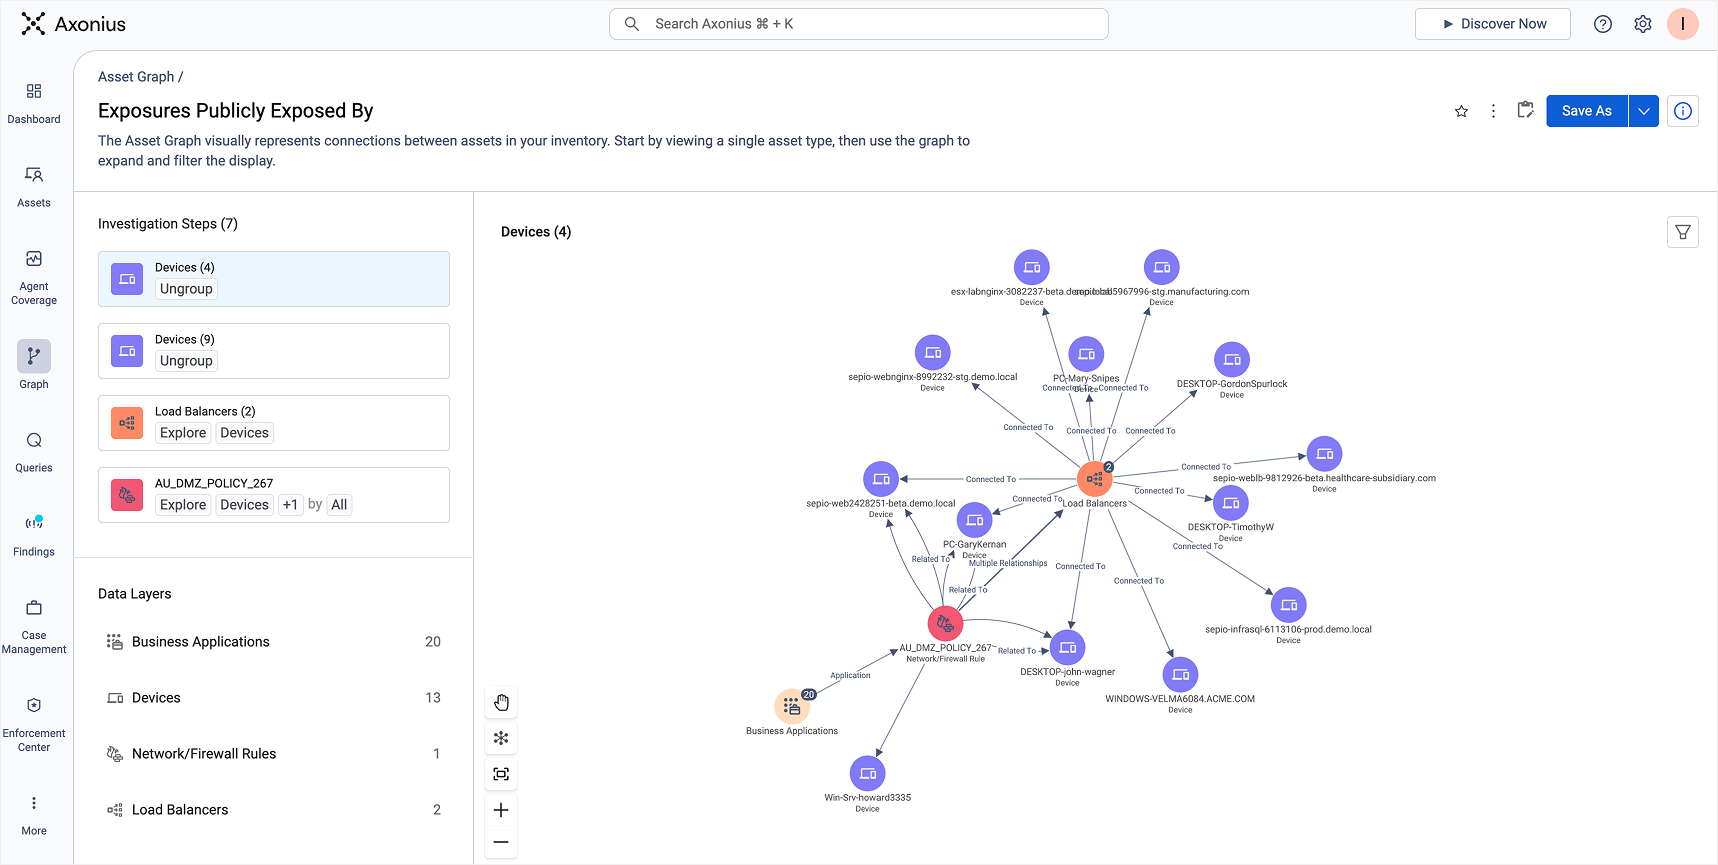
An Asset Graph representing assets publicly exposed
These modeled relationships allow Axonius to see the global attack surface from both the inside out and the outside in – so that when you ask us a question, you can be confident that you’ll get the truth in return.
Stage 6: Assess
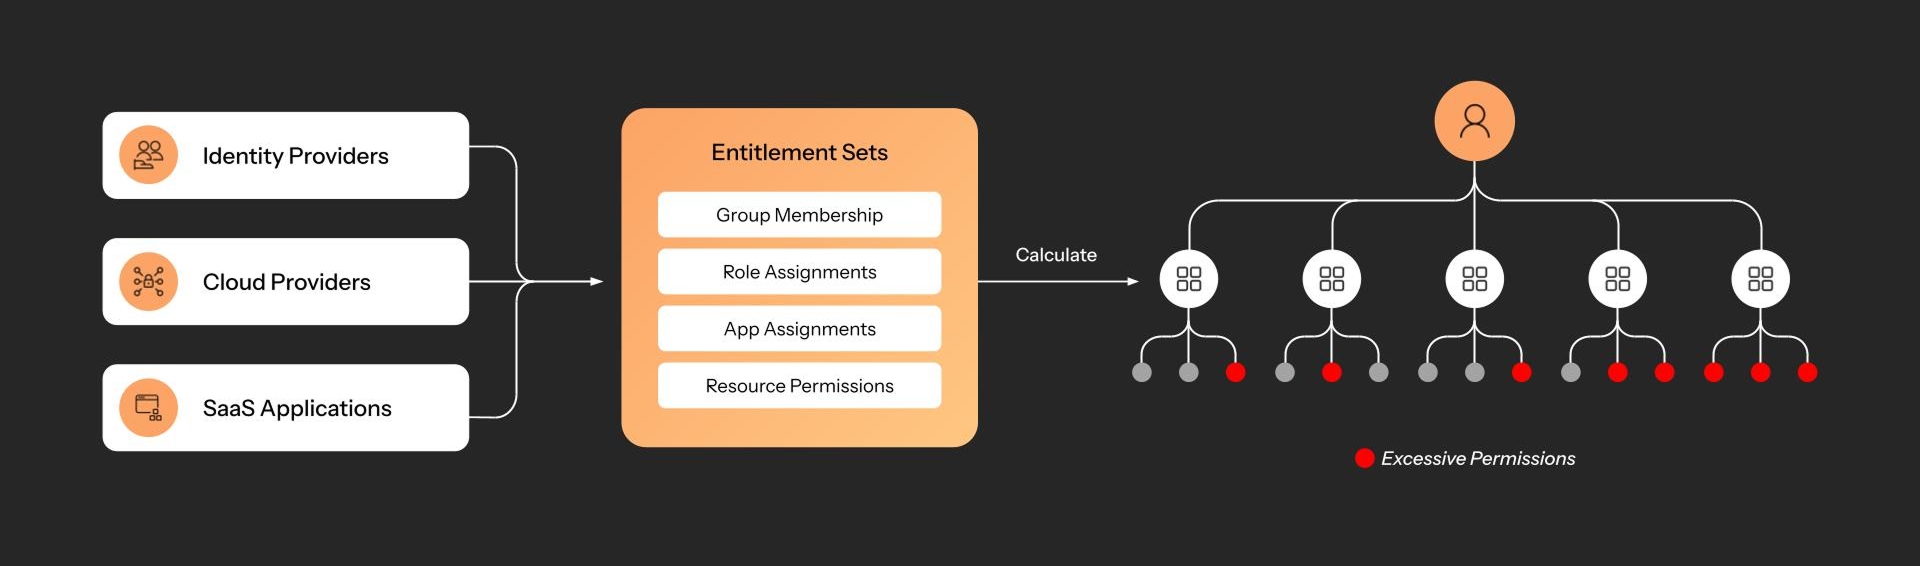
Example calculation - a user’s total effective permissions across all systems and applications
This is where frontend exploration begins. From this point on, every data point resulting from this pipeline is consumable through queries, dashboards, and APIs. But assessments are only as good as the context they operate on – turning raw data into reliable signals requires engineering across systems.
Evaluating posture requires joining conditions across identity, device, cloud, and app domains
Many exposures only surface when multiple attributes combine under the right conditions
Permissions, coverage, and configuration states often conflict across sources and must be reconciled
Environmental differences like tagging schemes, naming conventions, and control settings impact how posture is assessed
Risk definitions vary by organization, making static scoring insufficient without contextual awareness
Every stage of the pipeline so far culminates in a unified dataset that’s ready for actionable assessment. This is what enables Axonius to smartly evaluate risk, performance, and cost measures based on truthful, cross-domain context – not the isolated, fragmented data that originated from individual sources.
Assessment logic runs directly on this unified asset model, where all normalized fields, relationships, and enrichment data are queryable in real time.
Relationships between assets are traversed to assess coverage, access, or risk.
Filters and joins allow conditional evaluations
Findings are computed continuously, not batch-scanned, so results reflect live context
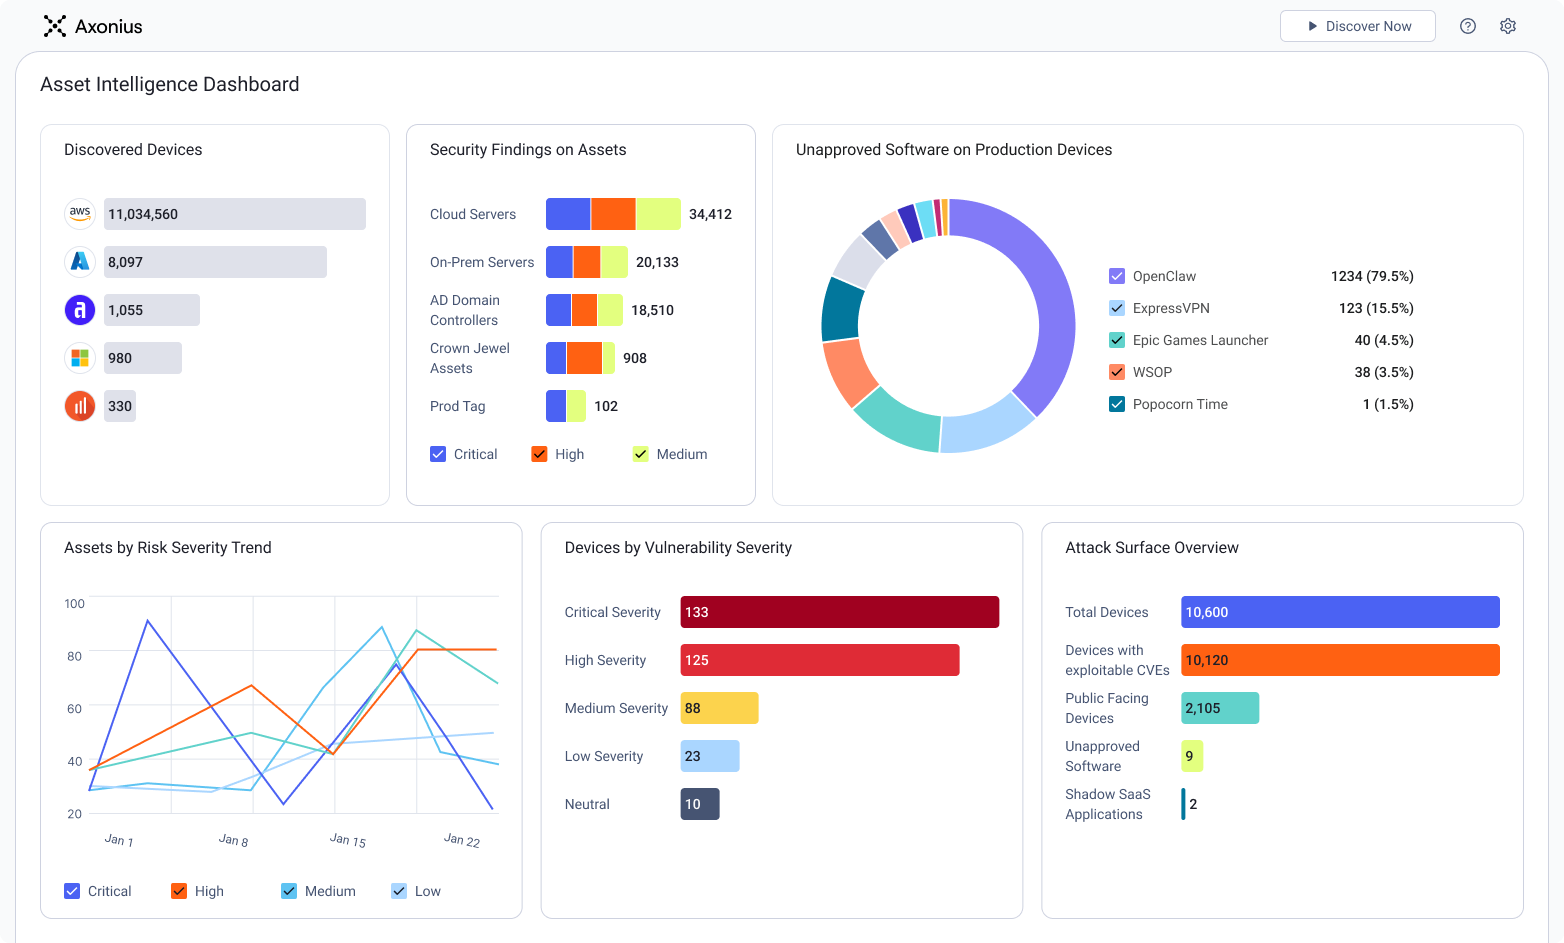
This data shows up in a number of ways across the Axonius platform – via queries, dashboards, findings, graphs, and more. It’s always a major focus of our roadmap investment to bring more out-of-the-box answers in more intuitive, user-friendly ways.
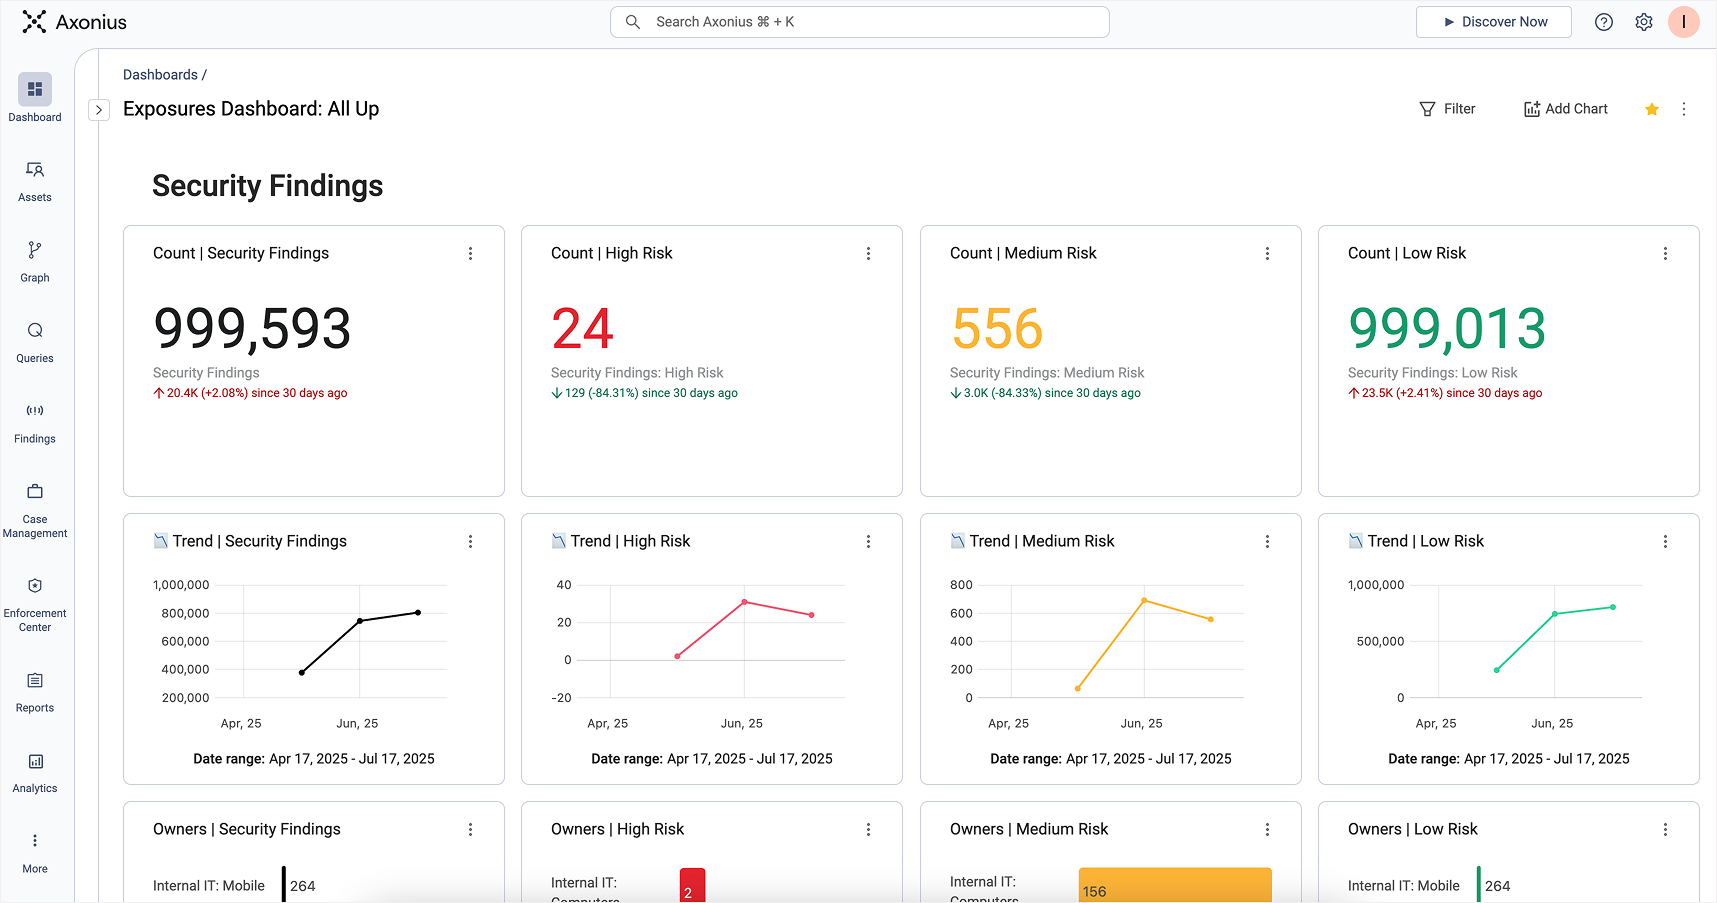
Dashboards in Axonius are the anchor for transforming visibility into actionability
What makes this especially powerful isn’t just asset data – it’s also the ability to combine asset context, business context, and threat context in one model. That means assessments can factor in real organizational impact, not just theoretical exposure, prioritizing what matters most to the business, not just what matches a signature.
Making Asset Intelligence Your Asset Intelligence
Asset intelligence isn’t one-size-fits-all. Every organization has its own nuances – naming conventions, ownership rules, tagging strategies, business units, and compliance guidelines to name a few. Even the set of configured adapters can dramatically shape how the pipeline behaves. Whether you're a single-cloud or multi-cloud shop, using Okta or EntraID as your IdP, relying on one EDR or five – those choices impact how assets should be discovered, correlated, and assessed.
Axonius is built to flex around your environment, and we provide a number of ways to tune the data pipeline to your liking:
Custom Correlation Rules: Define how assets are matched and merged across sources using flexible field weighting
Custom Enrichment: Inject internal knowledge or external intelligence into asset profiles using static, dynamic, or derived fields
Data Transformations: Clean, convert, or extract values inline to standardize data across systems
Custom Fields: Extend the schema with attributes that matter to your business, such as asset owner, data classification, or lifecycle stage
Field Mapping Overrides: Override default interpretations to better align incoming data with your internal definitions
By shaping the pipeline to fit your reality, Axonius ensures that asset intelligence is tailored to drive action in your world.
And your world continuously changes. Assets are in constant motion – spinning up, shutting down, changing states, or shifting ownership. Asset Intelligence must capture how your environment changes over time.
Axonius records every discovery cycle as a snapshot of your environment at that moment. As a result, you always have a complete view of your entire environment at any given time. At a granular level, every asset comes with a built-in changelog, capturing what fields were added, removed, or modified across time.
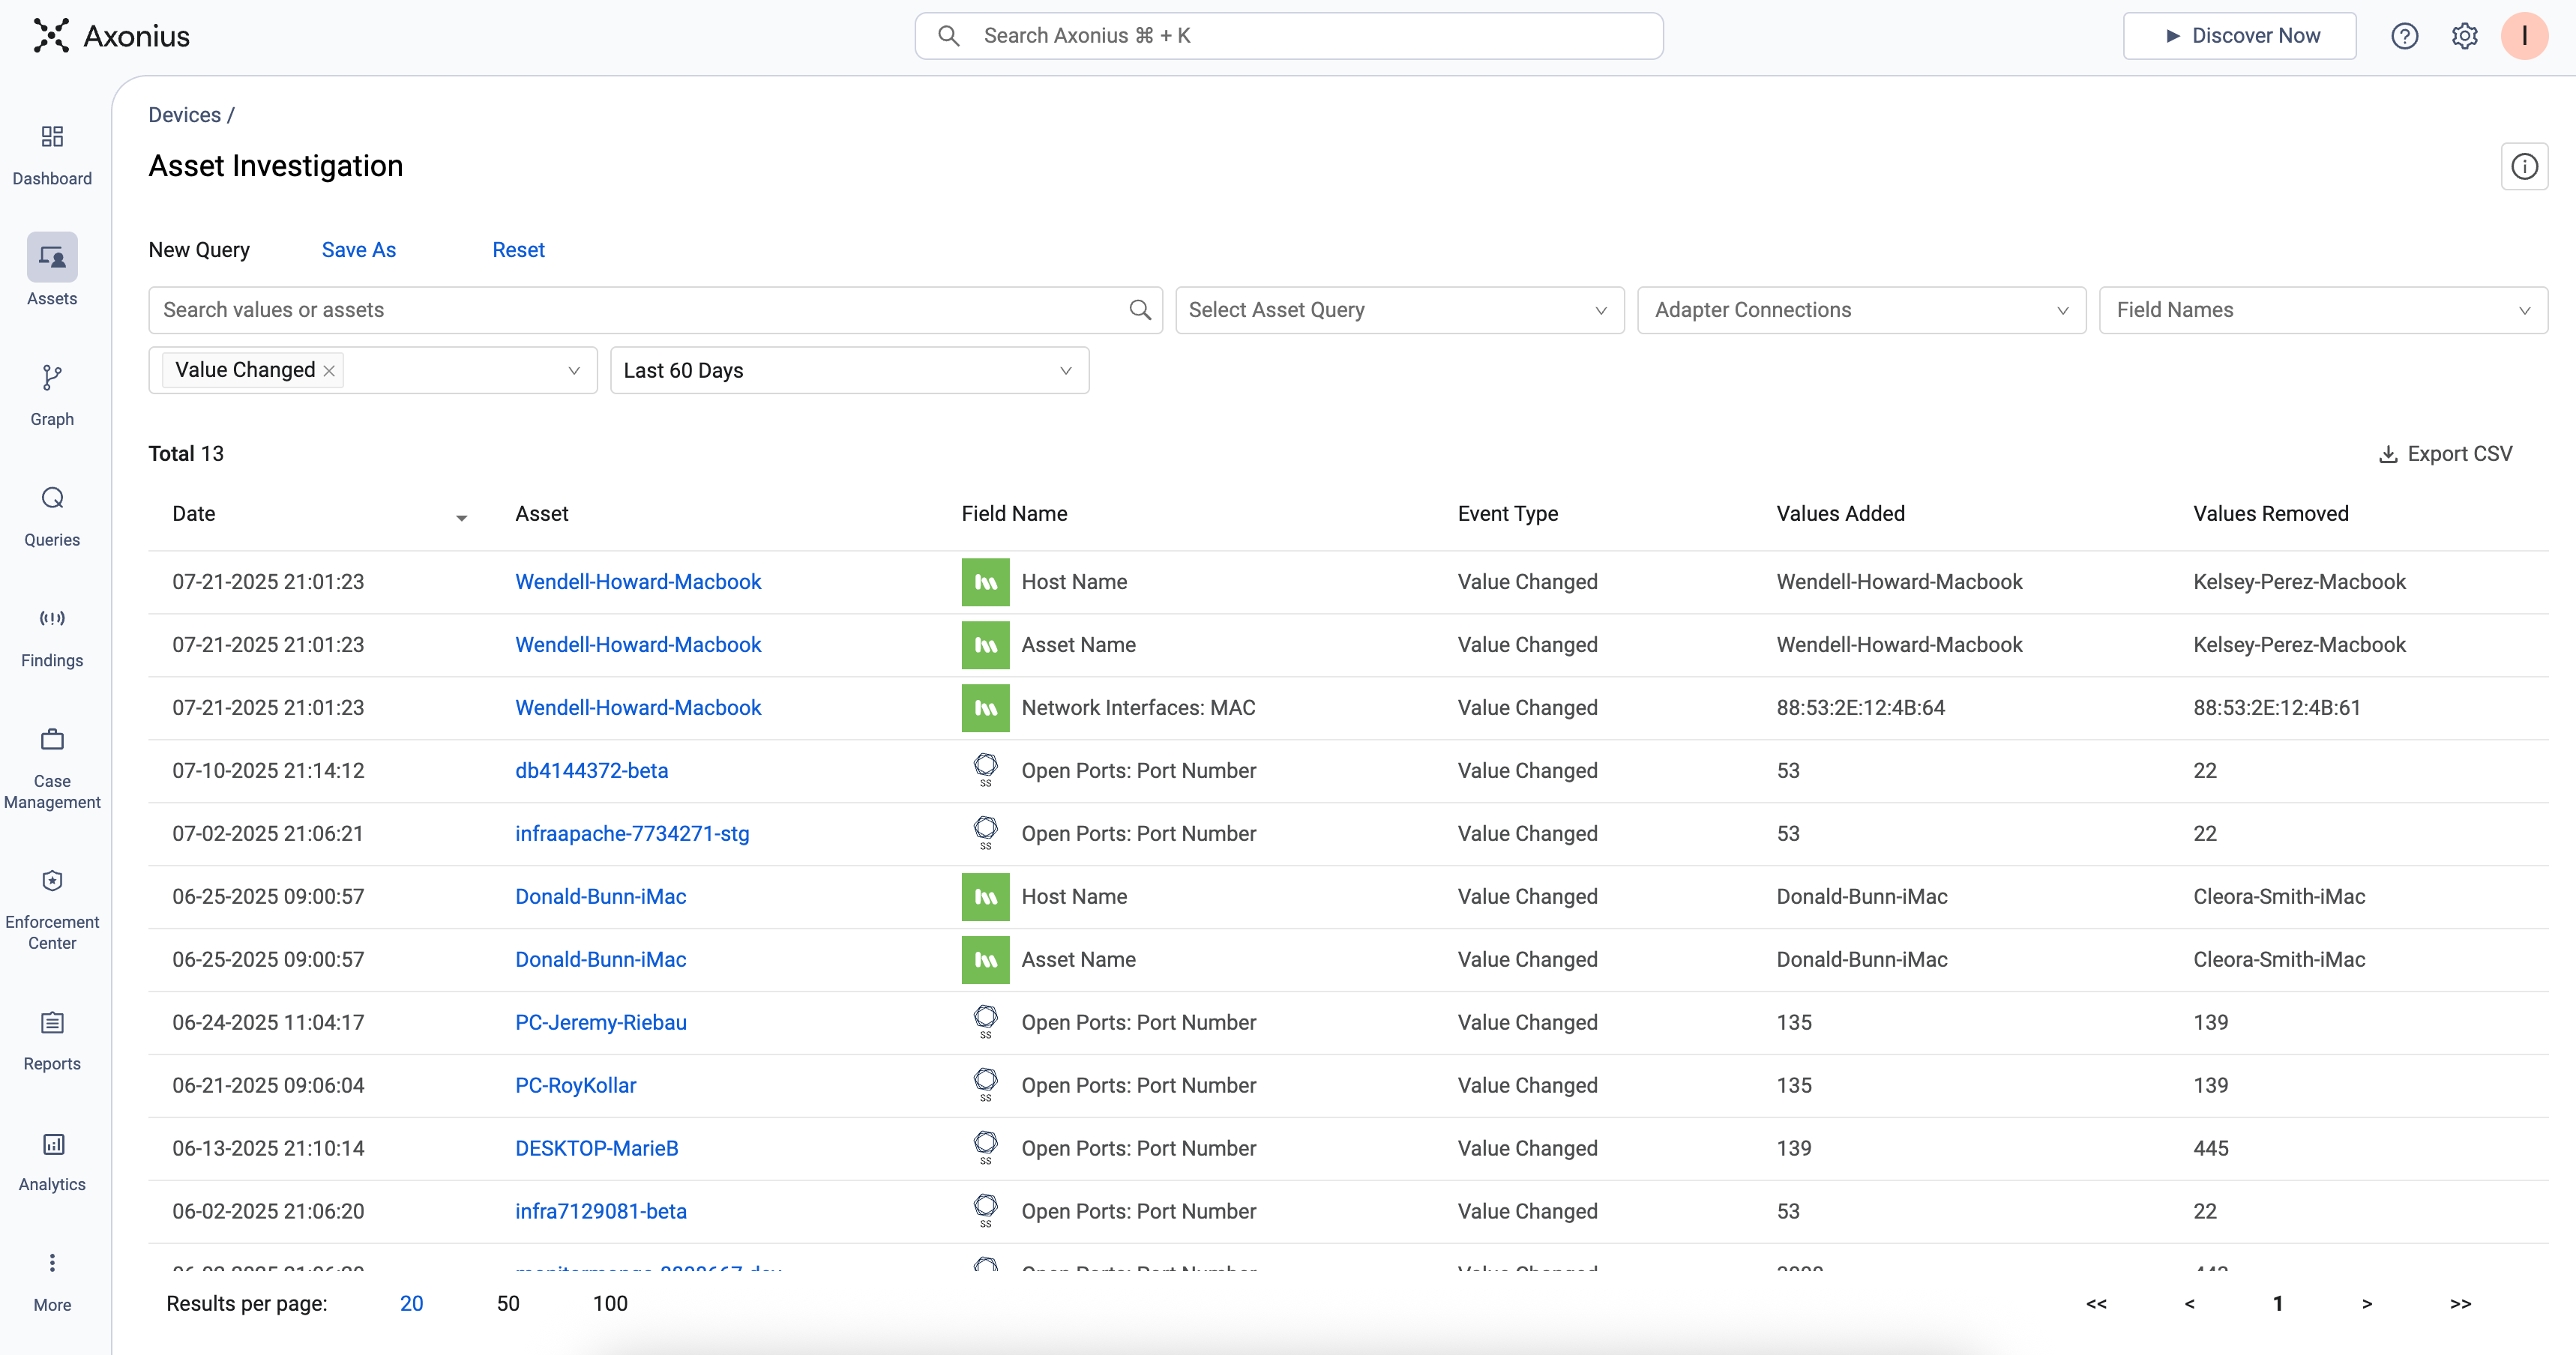
Asset Investigation displays field-level changes – representing an asset changelog
Time as a first-class citizen in the Axonius platform is one of the many reasons why Asset Intelligence is more than just an asset inventory. Time represents change, change involves drift, drift requires investigation.
Conclusion
Modern security teams are on a valiant quest for operational force multipliers – do more with less, act faster with confidence, and scale efforts without scaling headcount. But real leverage doesn’t start with automation. It starts with context.
This is the foundation Axonius builds. A pipeline purpose-built to turn raw, conflicting, and incomplete data into a unified, action-ready model of the environment – the whole environment. Every stage is engineered to make context reliable, so decisions, policies, and automations are based on truth.
Force multipliers demand action. In the next post in this Behind Actionability series, I’ll dive into how Axonius transforms asset intelligence into intelligent action. Welcome to the Actionability Era.
Categories
- Asset Management

Get Started
See how to make asset intelligence actionable with a guided demo:
- Stop chasing data — work from one asset model your entire team can trust.
- See what's exposed before it's a problem — surface coverage gaps automatically.
- Turn alert noise into action — cut thousands of alerts down, to the ones that matter.