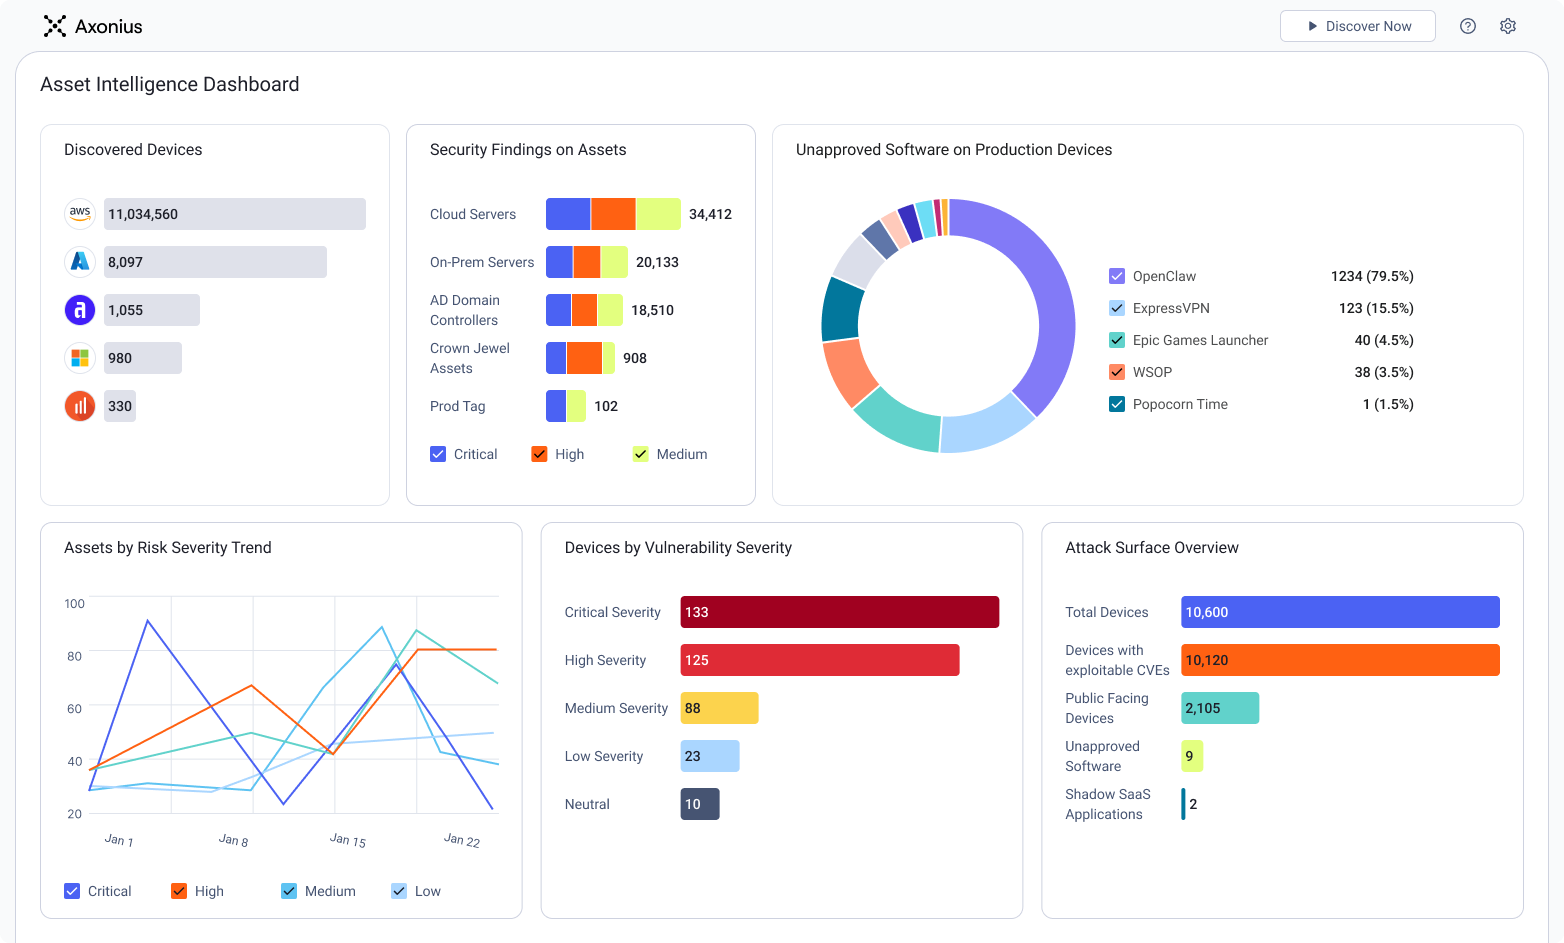
Skip to content
    Search

    Security is probably the only functional business area that is successful if nothing happens. Think about if nothing happened in other departments:

    • HR — If no one is hired, the business can’t grow.
    • Engineering/Development — If no code is written or no product is produced, there’s nothing to sell.
    • Marketing — If marketing can’t drive interest in the product, no one will find out about it.
    • Sales — If there is no revenue, the company shuts down.

    But when it comes to security, when nothing happens, things are going well.

    The challenge is that, in an increasingly metrics-based business world, it’s really hard to measure ROI when success is derived from a lack of catastrophic events.

    There have been several articles and conversations on LinkedIn looking at how information security teams both judge the performance of their teams, the ROI of security tools, and how they articulate value to their Board of Directors. In this post, we’ll look at some of the approaches and weigh the pros and cons.

    How Security Teams Report Performance

    In “CISOs and the Quest for Cybersecurity Metrics Fit for Business” from SecurityWeek.com, several CISOs and security experts gave their thoughts on security team metrics:

    “While some Board members may be aware of what firewalls are,” comments John Masserini: CISO at Millicom Telecommunications, “the vast majority have no understanding what IDS/IPS, SIEMs, Proxies, or any other solution you have actually do. They only care about the level of risk in the company.”

    and

    “The IT department led by the CIO typically must maintain uptime for critical systems and support transformation initiatives that improve the technology used by the business to complete its mission,” explains Keyaan Williams, CEO at CLASS-LLC. “The Security department led by the CISO typically must maintain confidentiality, integrity, and availability of data and information stored, processed, or transmitted by the organization. These departments and these leaders tend to provide metrics that focus on their tactical duties rather than business drivers that concern the board/C-suite.”

    Takeaway: while security teams focus on the how Board of Directors care about the why.

    Drew Koenig, consultant, and host of the Security in Five podcast sees the same basic problem.

    “In security there tends to be a focus on the technical metrics. Logins, blocked traffic, transaction counts, etc… but most do not map back to business objectives or are explained in a format business leaders can understand or care about. Good metrics need to be tied to dollars, business efficiency shown through time improvements, and able to show trending patterns of security effectiveness as it relates to the business. That’s the real challenge.”

    Finally, Tomas Honzak, CISO at GoodData, feels that reporting should be rare.

    “The board should not be hearing about security on a regular basis,” he told SecurityWeek. “Unless there is a critical issue or significant business transformation, an annual presentation of the key trends, evolution of the threat landscape and strategic security plans are all that the board should be receiving from security.”

    In summary, the business cares about enablement tied to dollars rather than knowing the details. But the same problem remains: how do you tie dollars to that which isn’t happening?

    Getting to a Number

    If we want to tie security performance to dollars, how do we get there? If we think of the security function as successful based on breach avoidance, we could start by looking at the average cost of a breach. Here are just a few examples:

    • Sponsored by IBM Security and conducted by Ponemon Institute, the 2019 Cost of a Data Breach Study found that the average cost of a data breach globally is $3.92 million, a 1.5 percent increase from the 2018 report
    • The same study noted that the costs associated with “mega breaches” ranging from 1 million to 50 million records lost, projected that these breaches cost companies between $42 million and $388 million respectively.
    • U.S. companies experienced the highest average cost of a breach at $8.19 million, followed by the Middle East at $5.97 million.
    • Lowest total cost of a breach was $1.35 million in Brazil, followed by $1.83 million in India.
    • For the 9th year in a row, Healthcare organizations had the highest costs associated with data breaches — costing them $429 per lost or stolen record — nearly three times higher than the cross-industry average ($150).

    That’s a pretty big range. First, we start at a global average of almost $4 million, but that can go as high as double in the U.S., and around half in Brazil. But if you’re in healthcare, that could be a 3x multiplier. Also, if we’re looking at a “mega breach,” that number jumps from between $42-$388 million.

    If you were to calculate this number, there are several variables:

    1. How many records would I lose? Even if my organization has more than 1 million records, should I assume that all of them would be lost due to a breach? 50%? 10%
    2. What’s the value of my data? If I’m in healthcare, I see that it’s $408 per lost or stolen record. But is that same cost for every record? Is a word doc worth the same as a patient’s PII? How do I adjust?
    3. Where am I located? We’ve all heard a lot about GDPR, and that has led to many conversations about where the data resides. Using the Ponemon/IBM study, we see that a breach in Brazil costs less than one in the U.S., but what about global organizations? Is my data only going to be breached in one region? All? Some? How would I adjust for this?

    Even if we’re to use the potential cost of a breach as our north star number for the right side of the ROI calculation, we also need to look at the other inputs:

    1. Cost of Security Staff — What is the all-in salary for my security staff (salary, bonus, and benefits)?
    2. Cost of Security Solutions — How much are the security management tools I’m using to keep data secure?

    Let’s Do Some Math

    Example 1: Breach-Based ROI

    Let’s make things simple and assume that a $4 million cost of breach figure is legit. A few other assumptions:

    • Company Size: 10,000 employees
    • Location: United States
    • Security Staff: 25 People
    • Average Salary: $150,000 ($3,750,000 total)
    • Endpoint Protection Tool Cost: $10/endpoint or $100,000
    • All Other Security Tool Costs (SIEM, VA Scanners, MDM, etc.): $25/endpoint or $250,000

    In total, the cost of staff plus tools is $4,100,000. But our cost of breach figure is only $4 million, so we’re $100,000 in the hole. That’s a negative ROI, so we should cut somewhere, right? In this case, it would be better to get rid of all of our security staff and tools, and just take the hit.

    Obviously, that’s ridiculous. We know that it is. But if we measure security ROI this way, it seems like a logical conclusion.

    Example 2: Time-Based ROI

    Rather than simply relying on potential losses from breaches, in this example, we’ll scrap the zero-sum game idea. Instead, we’ll agree that we definitely don’t want a breach and we will never tank our security just because having a team with proper tools may cost more in the short-term than a breach. We know that we always want to be as secure as possible within a reasonable cost and effort, so we’ll shift our thinking a bit.

    In this case, we’ll take the example of a cybersecurity asset management tool (Axonius), and we’ll look at how we could show ROI for that one tool rather than the entire security team as a whole.

    • Company Size: 10,000 employees
    • Location: United States
    • Security Staff: 25 People
    • Security Staff that Investigate Incidents: 5
    • Average Salary: $150,000
    • Salary of Incident Investigators: $750,000
    • # of Incidents Investigated Per Day: 20 Total (4 each)
    • Minutes Spent Getting Context Per Incident: 30

    In this case, we have the same company. They have 5 people dedicated to investigating incidents and they can handle 4 investigations each per day. Each of those investigations takes around 30 minutes just to research context around an alert (What is the device in question? Who owns it? Who was the last logged-in user? What vulnerabilities are present? Who has admin access? How does the device adhere to the security policy? What’s running on the machine?).

    That said, this company spends $187,500 per year just gathering context about alerts.

    If the company could reduce the amount of time from 30 minutes to 5 minutes, they could save $156,250.00.

    If they could go from 30 minutes to 2 and a half minutes, they could save $171,875.00.

    This method makes sense when looking at ROI of each individual tool, but doesn’t really consider the bigger picture. Additionally, it makes the security function sound like the sum of all the products it buys rather than taking into account all of the intangible benefits.

    Example 3: Contribution to Top Line Revenue

    Allan Alford, Delivery CISO at NTT DATA Services, came up with an idea that was really interesting. In his LinkedIn post, he posted an idea for tying tools and efforts to revenue.

    In short, he says that his security team assists with RFPs. For example, at a former company his team would get a request for proposal from a prospective customer. In their RFP requirements, the customer specifies things like “do you protect against malware?” or “do maintain a consistent set of security policies?” — the sort of “checkbox questions” prospective customers ask to make sure every vendor in their supply chain has security in mind.

    Alford then goes on to say:

    Each RFP clearly has a monetary value associated with it. It would be very easy to add up all the dollars from all the RFP’s and cross-reference them with the tools that satisfy the specific questions of all the RFP’s. The end result would be something like:

    • Antivirus — Associated with $1.3 million of potential revenue this quarter
    • Firewalls — Associated with $2.7 million
    • GRC Tool — Associated with $.8 million

    You get the idea. This could be a powerful metric. However, this could also completely undermine the greater mission by becoming the sole perspective on technologies. If a technology has a bad quarter or two in terms of RFP dollars, it could suddenly be devalued despite being a necessary technology.

    It’s a good point. Although I love the idea of turning security into a revenue-enabler, it then inextricably ties security to sales. What if there are sales that happen without an RFP? Or what if some RFPs simply don’t map to the security tools being used? What if the sales team is just having a bad quarter? Or if the marketing team stops being good at generating leads?

    The Hard-to-Measure Security Metrics

    I think it’s fair to say that each approach has merit as part of a larger metric, but on their own only tell part of the picture.

    A Kitchen Sink Approach

    Maybe there’s merit to each of these examples if we can strike a balance between measuring enough to matter without getting too granular.

    Breach Avoidance — Start with the cost of a potential breach, and get as close to a “real” number as possible. Given the size of the company, number of records, sensitivity of records, geography, etc., settle on a ballpark figure.

    Let’s use $5 million in this example.

    1. Tool ROI — Look at all of the security tools you pay for and split them into buckets.

    Tools that defend against breaches but don’t take staff time to operate: These are things like AV, EDR, etc.

    Let’s use an even $1,000,000 here.

    Tools that reduce the time staff spend on manual tasks: these are things that give time back to your staff to focus on more strategic items. Examples include automation and cybersecurity asset management

    Let’s use a $500,000 figure.

    Tools that provide valuable information, but require human time to make actionable (TI, SIEM)

    Let’s go with another $500,000.

    1. Staff Cost — We used a total, all-in cost of $3,750,000.
    2. Contribution to Revenue — Allan Alford’s idea to sum up all of the won RFP’s that the security team contributed to. Of course, since security didn’t source the deal, we’ll want to attribute a percentage of the revenue to security. We can use, say, 10% here and as an example, we’ll say that the security team has been a part of $8 million in sales in the past year.

    Cost of Breach — ((Total Cost of Tools + Total Staff Cost) + Contribution to Revenue) = Total Security ROI

    $5,000,000 — ($2,000,000 + $3,750,000) = -$750,000

    -$750,000 + (.10 * $8,000,000) = $50,000

    The idea here is to always try to get a positive number, thus showing that the combination of tools, staff, and contribution to revenue outweighs the cost of a breach.

    Sign up to get first access to our latest resources