

Key Takeaways
- Ian Lowe will be speaking at Gartner IT Symposium Xpo on November 10, sharing his thoughts about the ripple effect AI has on your backlog.
- Security leaders need to ask themselves 3 questions about their estate: Is the backlog growing or shrinking, how many shipped fixes las quarter held, and when does the clock start?
- A foundation of trust begins by answering: can you trust your findings, can you trust the fix to hold, and can you trust the fix to not break anything?
Last month I argued that AI made finding flaws cheap, didn't make fixing them safely any cheaper, and that someone else is chasing the same bottleneck. This post is for the people who have to fund the answer.
The good news first. Half of my argument is now mainstream. In November, McKinsey published guidance for CIOs, CTOs and CISOs that says the binding constraint has shifted from finding vulnerabilities to fixing them. It recommends three things:
running remediation at three speeds
keeping developers away from findings nobody can reproduce
retiring systems that cost more to secure than they're worth.
If you read my last post, that will sound familiar.
The bad news is that most guidance still misses the race between defenders fixing the flaws and attackers using it. Most guidance, McKinsey's included, starts the clock when a vulnerability is disclosed and treats the backlog as a cost to manage. In security, the backlog is also a target.
So I've tried to turn the argument into something a leader can measure.
I’ve created a simple model, written up in a short working paper the safe-fix gap. This post covers what the gap means for your budget and what you bring forward to your board. Let’s walk through the model.
Three questions to answer first
As a security or IT leader, you should be able to answer these three questions about your own estate.
Is your backlog of real risk growing or shrinking? Count only what's reachable and exploitable in your environment, rather than every finding a scanner returns.
Of the fixes you shipped last quarter, how many held? A fix holds when it closes the flaw everywhere it exists and doesn't break anything on the way.
When does your clock start? At the advisory, or when the fix went public and showed attackers where to look?
When I put these three questions to security leaders over a dinner in October, no one described measuring their capacity to fix safely.
The safe-fix gap
Each question maps to part of a simple model. The first is the gap, the second is trust in your fixes, and the third is when your risk clock starts.
Your safe-fix rate, S, is how many trusted fixes you can ship each week. Start with change capacity, C, the changes your teams can test, approve, deploy and check. Take away the capacity spent checking which findings are real in your environment, v for each of F findings. Then multiply by T, the share of fixes that actually hold.
S = (C - vF) x T
The cost of trusted findings ‘vF’is the one that surprises security people. Every finding eats into fixing capacity before a single fix is written, even the ones that turn out to be noise. So a flood of findings can shrink your safe-fix rate.
The gap, G, is real-risk arrivals minus safe fixes. Real risk means the share of findings, ρ, that are reachable and exploitable here.
G = ρF − S
If G is above zero, the real-risk backlog grows every week and never settles, no matter how well you prioritise. Each new flaw waits longer than the last. Prioritisation decides which flaws wait. Only closing the gap stops the pile growing.
Risk, R, is the third piece. In words, it's how much that matters arrives, times how long it stays open, times how hard someone is looking, times how much is left unguarded. Plus the harm your own fixes cause. The full formula is in my paper, including why the clock starts when the fix becomes public and why danger rises as a flaw ages.
The model also has an automated lane, where AI fixes low-risk flaws so people can focus on the ones that matter. It only helps if spot-checking an automated fix costs far less than doing it by hand, and if real risk isn't mislabelled as low risk on the way in.
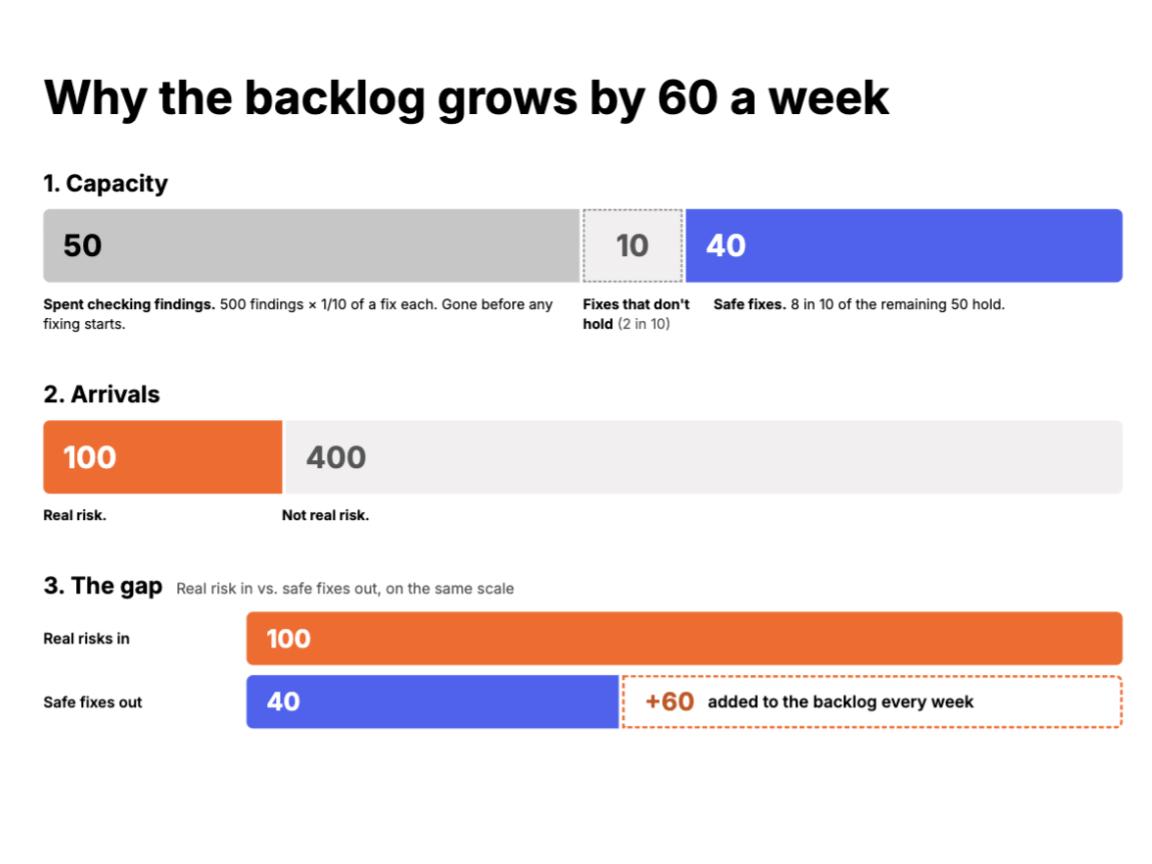
Example for illustration only: A team can safely ship 100 changes a week. 500 new findings arrive, and checking each one costs a tenth of a fix, so half the capacity is gone before any fixing starts. If 8 in 10 fixes hold, that's 40 safe fixes a week. If 1 in 5 findings is real risk, 100 real risks arrive, so the backlog grows by 60 a week.
Trust shows up three times
The model has three separate trust terms– v, T and c–because they're three different failures. Each asks the same question. Can you trust this?
Can you trust the finding? Every finding that isn't real still costs someone time to rule out. AI can cut that cost by checking reachability and building a working reproducer before a developer sees anything. McKinsey makes the same call, a reproducible trigger before an engineer is engaged.
Can you trust the fix to hold? This is where AI currently adds work. In one 2026 study of 6,080 AI-generated patches, only 26% were clean fixes, and about half looked fixed but left the flaw exploitable. Reviewing an AI patch properly takes about as much time and understanding as writing it.
Can you trust the fix not to break something? Testing, staged rollout and rollback protect you here. They're also the steps that get skipped when a deadline gets shorter with no extra capacity behind it.
So point AI at proving findings and at verification, impact analysis and test generation. Generating more patches mostly moves the work onto your reviewers.
Why another scanner can make things worse
Better discovery raises arrivals. If your gap is already positive, a new scanner grows the backlog faster, and in security that backlog is a potential entry for attackers.
There's evidence the gap is already positive for many organisations. McKinsey cites Verizon's 2026 Data Breach Investigations Report, where the median time to fully remediate known exploited flaws rose from 32 days to 43, and only about a quarter were fully remediated. Discovery sped up and fixing slowed down.
A day after McKinsey's article, OpenAI showed what this looks like at scale. Its research post describes an automated pipeline that produced 948 working Linux kernel privilege escalation exploits in a single run, for about $1.2 million in API costs, roughly $1,300 each. Over the 10 days of the research, 61 had been patched upstream.
The 61 shouldn't be read as a fixing rate. The maintainers asked for the most severe reports first, and the rest are going out in batches. But the shape is clear. Finding took one run. Fixing moves at the pace of people, and every upstream fix still has to pass through each distribution and then through your own change process. One research run results in thousands of queues, and once those patches are public, they show attackers where to look.
Every discovery budget should come with a plan for the fixing side.
OpenAI's own advice to defenders is telling. It suggests treating a low-privileged account on an unpatched system as good as root, and isolating workloads in sandboxes. That's buying time while the fix waits.
That doesn't mean stop finding. Attackers have the same AI, so slowing your own discovery just means you learn about flaws later than they do. It means every discovery budget should come with a plan for the fixing side.
In Goldratt's order, the money goes like this. First, spend scarce fixing capacity on what's actually reachable. Then make work flow in that order. Only then add capacity. Adding change capacity while findings are still expensive to trust mostly buys more triage, so put it where the safe-fix rate is weakest. In most estates that means testing, staged rollout and verification, an automated lane for low-risk fixes, and retiring the systems that soak up fixing time. McKinsey calls retirement often the cheapest remediation option, and I agree.
What to bring to the board
McKinsey suggests boards see three numbers each quarter against their risk appetite, the exposure window, the backlog on critical systems and supplier patch speed. That's a good start.
I'd make two changes. Start the exposure clock when the fix goes public, and add the numbers that show whether you can close the gap at all.
Number to report | What it tells the board | Model term |
Real-risk arrivals per week against safe fixes shipped per week | Whether the backlog is growing or shrinking | G |
Share of last quarter's fixes that held | Whether rushed or AI-written patches are creating rework | T |
Exposure-days on reachable systems, counted from the public fix | How long attackers have had a map | R |
Fixes reopened, rolled back or redone | Whether tighter deadlines are buying speed with breakage | T and c |
Supplier time from public fix to a patch you can apply | Whose fixing capacity you're waiting on | S, for suppliers |
None of these need new tooling to start. Rough monthly figures for one critical system will tell you more than precise figures for none.
Where I might be wrong
The model is uncalibrated. It sets out the terms and how they fit, with no data yet. Some terms, like the cost of trusting a finding and the share of fixes that hold, are things most organisations don't measure today. And AI may get better at verifying fixes sooner than I expect, which would close the gap from the fixing side. I hope it does.
I'm presenting this at Gartner Symposium Europe on November 10th. If you’re there, come to my session. I’d love your feedback. Not going but you lead a security team? I want to hear from you. Share rough ranges for any of the numbers above and where you numbers say I’m wrong.
I work in exposure management at Axonius. The views here are my own, and this isn't a pitch.