See How Asset Discovery Tools Work in Axonius: From Connection to Action
Step 1: See your full asset landscape
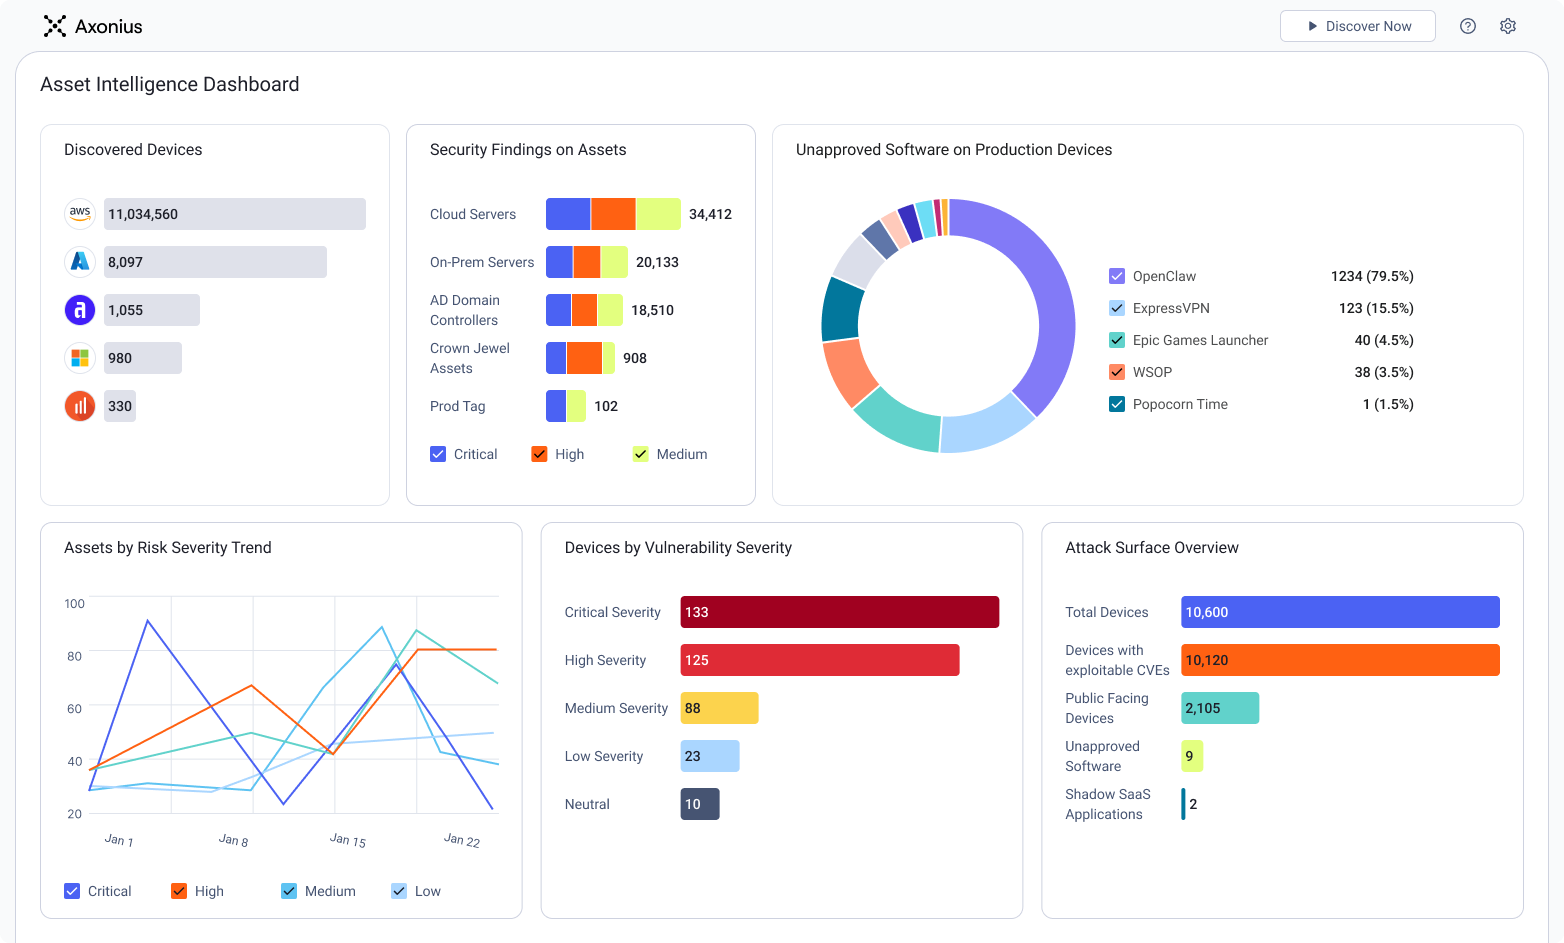
Instantly get a complete view of assets in your environment, with dashboards and charts that have detailed breakdowns of assets in Axonius from each adapter, historical asset discovery trends, and characteristics like OS distribution, network appliances and more. You can even see which assets are unmanaged or previously unknown.
Step 2: Connect data sources through API-based adapters
Asset data in Axonius is entirely configured through API-based adapters - no agents, no scanners required. For example, the AWS adapter gives you the flexibility to pull in specific data like ECS and EKS clusters, VPNs, IAM groups, etc.
Step 3: Build correlated, high-fidelity asset profiles
As you configure adapters, Axonius builds an asset profile for every type of asset pulled into the platform. You’ll see details like MAC address, IP address, OS Type, Installed Software, OS Type and Version. These records are correlated across all adapters to give you a high-fidelity asset profile.
Step 4: Take action from a single platform
Visibility is great, but you need to take action on what you see. Using the Action Center, choose from over 600 actions across all adapters - send a notification, push files and commands, or open a ticket in your ITSM, isolate a device.